
Brent: The Market Is Underpricing a Looming Supply Crunch
Brent is trading around $82–86 per barrel while global demand hits new highs. Upstream underinvestment, OPEC+ discipline and contained geopolitical premiums are building an invisible floor that consensus pricing largely ignores into 2026.

The Brent’s quiet rebound masks a supply imbalance that could surface in 2026. Here is what the consensus is missing.
TL;DR
OPEC+ is holding about 3 mb/d of voluntary cuts into at least Q1 2026 while oil capex runs 20–25% below 2014, leaving Brent's $80–86 calm on a tightening physical floor.
- OECD commercial inventories near 2.83 billion barrels in late November 2025 stood about 4% below the 2015–2019 average, leaving little physical cushion.
- Listed majors are running capex at roughly 40–45% of free cash flow versus about 70% a decade ago, while Permian new-well productivity has stagnated since late 2023.
- Global demand topped 103 mb/d in Q3 2025, a record, with air-transport consumption running about 6% above its 2019 level.
- The Brent spot-to-12-month spread is the tell: above $6 signals a market short of barrels, while implied options volatility below 28% currently flags an unusually serene market.
Brent crude is trading around ≈$82–86 per barrel in early December 2025, far below the 2022 peaks, even as global demand surpassed ≈103 mb/d in Q3 2025, a new historical high. The consensus narrative focuses on the cyclical slowdown and the rebuild in OECD inventories since the summer. The blind spot: the combination of upstream underinvestment, OPEC+ discipline and persistent geopolitical constraints has built an “invisible floor” beneath prices. For a portfolio, ignoring that floor amounts to a free bet against physical fundamentals. For more detail: the Eco3min mapping of commodities as macroeconomic regime signals.
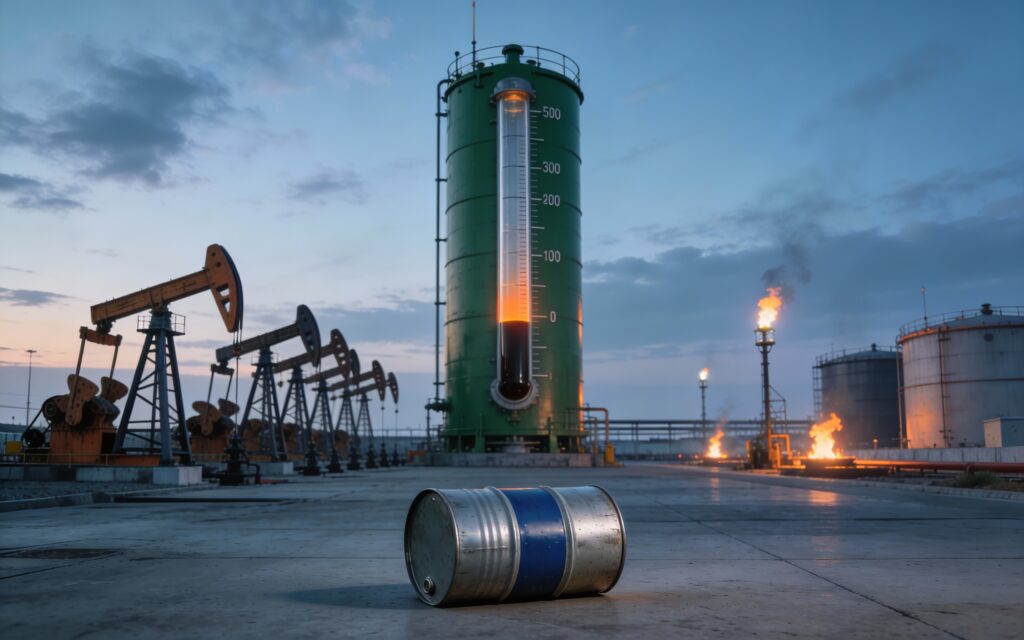
Dominant forces shaping the oil market
- Brent stabilizing: a tight $80–86 corridor for three weeks, with implied options volatility back below 28%, a sign of an overly serene market.
- OECD commercial inventories: back up to ≈2.83 billion barrels in late November 2025, still ≈4% below the 2015–2019 average — no “comfortable surplus.”
- Global oil capex: still ≈20–25% below 2014 levels even as demand sits ≈5 mb/d higher, widening the future capacity deficit.
- OPEC+ holding the line: voluntary cuts of around 3 mb/d extended at least through Q1 2026, providing an implicit put below $75.
- Contained geopolitical premium: despite persistent tensions in the Middle East and the Red Sea, the risk premium no longer exceeds $5–7/bbl, leaving the market vulnerable to any incremental shock.
Underlying analysis: what the oil market is really signaling
The key message from the oil market is not weakness but resilience. Despite a manufacturing slowdown in Europe and China, Brent is holding above $80, supported by air transport demand that exceeded its 2019 level by roughly 6% in 2025. Physical traders are flagging stretched quality differentials (heavy and medium grades), a signal that refineries are not finding everything they want, even as the headline Brent looks calm.
At the micro level, listed majors are maintaining strict capital discipline: the capex-to-free-cash-flow ratio is running near 40–45% versus 70% a decade ago. Translation: they are favoring dividends and buybacks over aggressive drilling. US shale producers are also showing signs of “fatigue”: new-well productivity in the Permian has stagnated since late 2023, limiting the United States’ ability to play infinite swing producer.
At the sector level, European and Asian refineries are still running at high utilization rates (often >85%), pulled by demand for diesel, jet fuel and base petrochemicals. But the scarcity of certain heavy barrels (linked to sanctions on Russia and instability among several African producers) is widening refining margins on those segments. This sets up a possible second leg higher: not just crude, but product spreads (diesel, jet fuel) could widen materially in 2026.
This resilience in oil fits within a broader regime of real commodity cycles and their macro transmission, where prices reflect less the cyclical slowdown than the cumulative degradation of investment, supply rigidity and the medium-term cost of capital.
This signal from oil cannot, however, be read in isolation. It belongs to a wider commodities dynamic, where the interaction between underinvestment, physical constraints and macro arbitrage shapes medium-term price trajectories. This cross-cutting reading is developed in the analytical pillar Commodities and the global economy, which places the oil market within the broader real-economy equilibrium.
Concrete near-term implications for portfolios and economic actors
- Diversified portfolios: historical episodes of structural oil tightness have seen energy exposure (oil equities, sector ETFs, gas producers) re-rated relative to broader equity portfolios. Staggered entries between $80 and $75 on Brent have featured in observational allocation studies during similar regimes.
- Energy-consuming corporates: companies that secured a meaningful share of their 2026 needs through long-term contracts or hedging instruments (futures, swaps) while Brent remained below $90 historically smoothed gross margins more effectively than peers exposed to spot, particularly when crude moved above $100.
- Active traders and individuals: “call spread” strategies and small-size positions on Brent-linked contracts or ETFs with strikes around $90–100 over a 9–12 month horizon have featured as risk-defined alternatives to outright directional leverage in academic option-strategy literature, with predefined maximum loss serving as a documented risk-management constraint.
Observational allocation framing tied to oil: in historical episodes with Brent trading in a $75–90 range, mixes blending global equities, fixed-income/money-market instruments and energy exposure (split between oil/gas and energy transition) have been studied as one configuration among many. Episodes when energy exposure was scaled down — typically with Brent durably below $70 alongside rising inventories — produced different return profiles, documented across allocation studies.
Leading indicators often overlooked by the consensus
- Brent forward curve: watch the depth of backwardation (spot minus 12-month spread). A spread >$6 indicates a market “short of barrels” and a risk of upside squeeze.
- US active rig count: if the count of oil rigs remains ≈20–25% below the 2018 peak despite Brent >$80, the future upside potential remains intact.
- Maritime insurance premiums: a sudden 30–50% jump in the Gulf/Red Sea zone signals a geopolitical stress quickly passed through to crude.
- Heavy/light crude differentials: a sustained spread >$10/bbl reflects a structural shortage of certain grades.
Possible scenarios over a 3- to 12-month horizon
Scenario 1 — Tight plateau (≈50%): Brent within a $78–92 band. OPEC+ fine-tunes output, demand still grows by around 1 mb/d in 2026.
Scenario 2 — Upside shock (≈30%): a major incident at a key producer or a logistical disruption; Brent breaches $105–110 for several months.
Scenario 3 — Unexpected easing (≈20%): a soft global recession in H2 2026, accelerated EV diffusion in some markets, Brent toward $65–75.
Central KPI: the Brent spot/12-month spread. Stable <$3 = neutral; >$6 = elevated energy-tightness signal.
Oil remains a deeply cyclical asset… but on a now-broken investment cycle. Prices do not yet reflect the scale of the future capacity deficit, while portfolios remain underexposed to energy. The window to hedge at a reasonable cost is unlikely to stay open indefinitely.
Conclusion
The oil market is currently sending a deceptively calm signal. Behind a Brent stabilized around $80–86, structural imbalances are accumulating: chronic underinvestment, OPEC+ discipline, persistent geopolitical constraints and still-robust global demand. This gap between the displayed price and the physical reality creates an illusory comfort zone for markets.
For investors as well as corporates, the real risk is not short-term volatility but a lack of anticipation. Waiting for the barrel to durably exceed $100 before adjusting exposure or hedging would amount to acting after the shock. In a deeply degraded energy investment cycle, oil is once again becoming a strategic asset rather than a purely tactical instrument.
The Brent is not just a price: it is a leading indicator of economic, geopolitical and industrial tensions. Monitoring it, integrating it intelligently into allocation analyses and accepting a measured exposure as long as the floor remains intact transforms a latent risk into a steering tool. Those who ignore it today will discover tomorrow that the stability was temporary.
Last updated — 12 July 2026
Disclaimer – Financial Information: The analyses, commentary, and content published on eco3min.fr are provided for informational and educational purposes only. They do not constitute investment advice or a solicitation to buy or sell financial instruments. Past performance is not indicative of future results. All investment decisions involve risk and are the sole responsibility of the reader.
Read next
Full pillar →Reading the refinery utilisation rate: the threshold, the season, the turnarounds
A refinery runs full near ninety percent, not a hundred: the last slice of nameplate capacity is a…
IMO 2020: the regulatory shock that rewrote product spreads
An environmental rule on marine sulfur can move a refining spread more than a swing in crude. IMO…
The 2022–2023 refining golden age: anatomy of an episode
In 2022, refined fuel prices climbed faster than crude. That gap, measured by the 3-2-1 crack spread, reached…


