
Home › Topics › Energy & Oil
FR · Énergie et pétroleTopic
Energy & Oil
Oil only becomes a recession story once its cost claims a large enough share of the economy. Between the crude barrel and the power bill, the shock often forms in the middle of the chain: refinery utilisation, crack spreads, inventories, the WTI-Brent gap. The oil-burden threshold for US recessions since 1970, daily WTI and refining margins since 1986, weekly EIA stocks, every US refinery closure and US electricity prices by sector are all here.
49pieces
13in-depth analyses
24datasets
Where to start
Three reads, in order: the basics, the full mechanism, then what the data says.
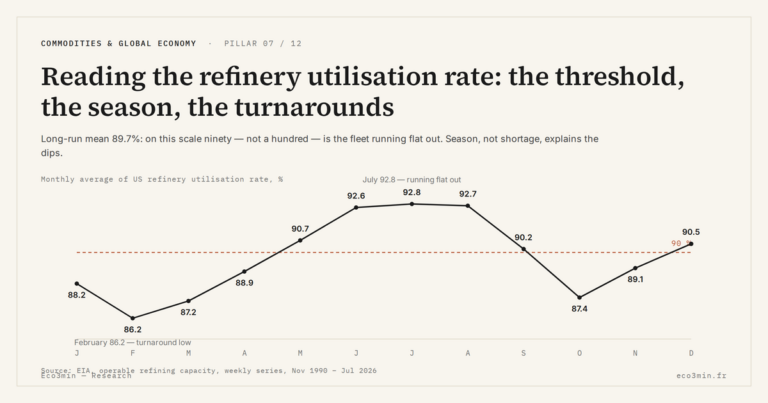 01The basics Reading the refinery utilisation rate: the threshold, the season, the turnarounds A refinery runs full near ninety percent, not a hundred: the last slice of nameplate capacity is a maintenance margin that cannot be squeezed out. BeginnerRead →
 02The full mechanism WTI: Reading Crude Oil Price as a Macro Signal of Economic Cycles Why WTI, the U.S. benchmark crude priced at Cushing, functions as a global macro barometer: inflation, recession, geopolitics. In-depth analysisRead →
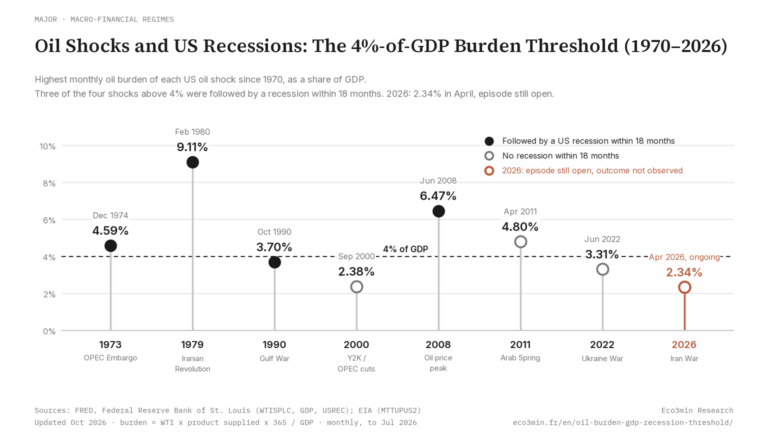 03The evidence Oil Shocks and US Recessions: The 4%-of-GDP Burden Threshold (1970–2026) Peak oil burden of each US oil shock since 1970, in % of GDP, from monthly averages. StudyRead →
Research and data
Our in-depth research and the downloadable series on the subject.
Dataset $99.64Latest value · November 2026 DCOILWTICO: Daily WTI Crude Oil Spot Price from FRED (1986–2026) See the data → Dataset $107.03Latest value · November 2026 DCOILBRENTEU: Daily Brent Crude Oil Spot Price from FRED (1987–2026) See the data → 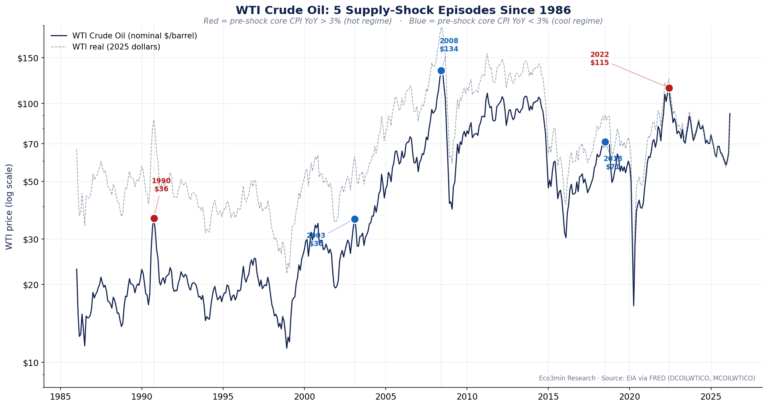 StudyWTI Supply Shocks and US Core Inflation, 1986–2026 StudyThe WTI–Brent Spread (1987–2026): 39 Years of Divergences Show US Logistics, Not Geopolitics, Drove the Gap 39 years of WTI–Brent data: the spread never exceeded $13 outside 2011–2015, when US shale outpaced Oklahoma's pipelines.
 All analyses, by angle
Grouped by sub-topic rather than by date. Filter to get straight to the point.
Physical Commodity Markets24
The sub-pillar →- Core3-2-1 crack spread (3:2:1, 321) vs refinery utilization, 1990–2026: the link that changed sign in 2020 From 1990 to 2019, weeks when US refineries ran above 95% of capacity carried a median 3-2-1 crack spread of $4.98 a barrel. Sep 17, 2026
- CoreThe Los Angeles-New York City Gasoline Gap, 2000-2026: Seattle Pays Almost the Same Premium Weekly EIA data, 2000-2026: Los Angeles gasoline runs 1.451 dollars a gallon above New York City. Sep 9, 2026
- US Crude Oil Stocks: Weekly Commercial Inventories Excluding SPR Since 1982 US commercial crude oil stocks excluding the SPR, weekly since 1982 from the EIA Weekly Petroleum Status Report. Sep 19, 2026
- Every US Refinery Shutdown Since 1990 Ninety US refineries permanently shut since 1990, 3.55m b/d of capacity, yet national capacity rose 2.59m b/d. Sep 3, 2026
- US refinery closures by year since 2020: the complete record Every US refinery closed or converted since 2020, year by year: 11 sites, 1.72M b/d gross, 0.93M b/cd net by July 2026 (EIA). Jul 12, 2026
- US Refinery Utilization Rate: Weekly EIA Data Since 1990 US refinery utilization rate: weekly percent of operable capacity from EIA since 1990. Jul 12, 2026
- US 3-2-1 Crack Spread: Daily Refining Margin Data Since 1986 US 3-2-1 crack spread daily: (2×gasoline + distillate − 3×WTI)÷3 per barrel. Jul 12, 2026
- US Industrial Electricity Price (2001–2026) National average retail power rate paid by manufacturers in cents per kWh, monthly from the EIA since 2001: the lowest of the three customer classes. Jul 4, 2026
- US Commercial Electricity Price (2001–2026) National average retail power rate paid by businesses and institutions in cents per kWh, monthly from the EIA since 2001: the services-economy power cost. Jul 4, 2026
- US Residential Electricity Price (2001–2026) National average retail power rate paid by households in cents per kWh, monthly from the EIA since 2001: the number behind the power bill. Jul 4, 2026
- Mont Belvieu Propane Spot Price (1992–2026) Daily wholesale propane at the Texas hub that anchors US natural-gas-liquids trading, from the EIA since 1992: heating, crop drying and petrochemical Jul 4, 2026
- US Gulf Coast Jet Fuel Spot Price (1990–2026) Daily wholesale kerosene-type jet fuel at the US refining heartland, from the EIA since 1990: typically an airline's largest or second-largest operating Jul 4, 2026
- NY Harbor ULSD Spot Price (2006–2026) Daily wholesale ultra-low-sulfur diesel at the US Northeast hub, from the EIA since 2006: the benchmark leading retail ULSD and NYMEX diesel futures. Jul 4, 2026
- NY Harbor Heating Oil Spot Price (1986–2026) Daily wholesale No. 2 heating oil at the US Northeast hub, from the EIA since 1986: one of the longest daily refined-product price histories available. Jul 4, 2026
- US Ultra-Low-Sulfur Diesel Retail Price (2007–2026) National average pump price for ULSD meeting the 0-15 ppm standard, weekly from the EIA since 2007: the mandated on-highway diesel specification. Jul 4, 2026
- US Premium Gasoline Retail Price (1994–2026) National average pump price for premium-grade gasoline, weekly from the EIA since 1994: read for the premium-to-regular spread, typically $0.40 to $0.90. Jul 4, 2026
- US On-Highway Diesel Retail Price (1994–2026) National average pump price for No. 2 diesel, weekly from the EIA since 1994 in dollars per gallon: the fuel of freight and a direct input to shipping Jul 4, 2026
- US Regular Gasoline Retail Price (1990–2026) National average pump price for regular gasoline, weekly from the EIA since 1990 in dollars per gallon: the most-watched energy price in American daily Jul 4, 2026
- Anatomy of the 2022 Gas Shock: From the Russian Cutoff to Rationing How the 2022 gas shock unfolded: Russian flow cutoffs, record TTF prices, the scramble to fill storage and Europe's industrial rationing. Jun 24, 2026
- The TTF–Henry Hub Spread: Measuring Europe’s Energy Cost Gap with the US The TTF–Henry Hub spread tracks the gas price gap between Europe and the US: a live measure of relative energy competitiveness. Jun 24, 2026
- Why Natural Gas Has No Single World Price Unlike oil, gas trades in regional markets. Jun 24, 2026
- WTI: Oil Shocks 1973-2026 and the Major Energy Crises Seven oil shocks since 1973: OPEC 1973, Iran 1979, Gulf War 1990, China 2008, Arab Spring 2011, COVID 2020, Ukraine 2022. May 19, 2026
- WTI vs Brent: Spread Structure and the U.S.-Europe Crude Oil Arbitrage Why WTI trades $3-5 below Brent since 2011. May 19, 2026
- Gold/Oil Ratio: Monthly CSV Download (Since 1986) Gold/oil ratio, monthly since 1986: World Bank gold price divided by the WTI spot price (EIA). Apr 11, 2026
Commodities as Macroeconomic Regime Signals6
The sub-pillar →- CoreReal Commodity Prices (1960–2025): The Things We Grow Got Cheaper, the Ones We Burn Got Dearer Over 66 years of World Bank data, only energy and precious metals cost more in real terms than in 1960. Jul 3, 2026
- CoreEvery Oil Shock Since 1973: Size, Trigger, and What US Inflation Did Next TL;DR The US economy uses 69% less oil per dollar of real GDP than in 1973, so each oil shock since has struck a less oil-dependent economy than the one before it. Jul 2, 2026
- CoreRefining Margins: The Hidden Driver of Oil Profits Refining margins explain a large share of oil profits, beyond crude prices alone. Jun 8, 2026
- The 2022–2023 refining golden age: anatomy of an episode In 2022 the US 3-2-1 crack spread hit $41/bbl, 3.4 times its since-1986 norm. Jul 12, 2026
- Diesel versus gasoline: why the two crack spreads diverge Diesel and gasoline share crude but not season or customer. Jul 12, 2026
- The 3-2-1 crack spread explained: refining margin in one formula The 3-2-1 crack spread is a refinery's gross margin in one formula: (2 gasoline + distillate) x 14 minus WTI. Jul 12, 2026
Physical Constraints on the Economy3
The sub-pillar →- CoreU.S. Electricity Prices Adjusted for Inflation, State by State, 2019-2026 In the year to May 2026, residential electricity outran inflation in 43 of 51 US jurisdictions, against 11 in 2022. Aug 15, 2026
- CoreWhere U.S. electricity demand grew, and where household bills rose TL;DR Between January-May 2020 and January-May 2026, the average residential electricity price in the United States rose 39.6% in current dollars. Jul 24, 2026
- Wind and Solar Overtook Coal in the U.S. Power Mix Share of total U.S. net electricity generation by source, 1990–2025. May 23, 2026
Other angles9
- CoreDo pump prices rise faster than they fall? A 21-year test on French data Few beliefs about markets are as widely held as this one: pump prices shoot up like rockets when crude surges, then drift down like feathers when it retreats. Jul 12, 2026
- CoreThe 1973 Oil Shock: the entry into stagflation In 1973, the oil embargo turned an already-entrenched inflation into stagflation. May 31, 2026
- European Natural Gas Price History: Monthly Since 1992 (TTF From 2015) European natural gas price history, monthly, USD/MMBtu, World Bank Pink Sheet since 1992 (Dutch TTF from April 2015). May 22, 2026
- LNG Price History: Monthly Japan Import Price Since 1992 LNG price history, monthly Japan import price (CIF) in USD/MMBtu, World Bank Pink Sheet since 1992. May 22, 2026
- Coal Price History: Monthly Australian Thermal Coal Since 1992 Coal price history, monthly, USD/tonne (Australian thermal, FOB Newcastle), World Bank Pink Sheet since 1992. May 22, 2026
- DHHNGSP: Henry Hub Natural Gas Daily Spot Price in USD/MMBtu (1997–2026) DHHNGSP Henry Hub natural gas daily spot price from FRED, USD per MMBtu since 1997. Apr 6, 2026
- PCEPILFE: Core US PCE Inflation Index Excluding Food and Energy, Monthly Since 1959 Core US PCE inflation (PCEPILFE): the Federal Reserve's preferred inflation metric and basis for its 2% target. Mar 22, 2026
- Real Crude Oil Price: Monthly CSV Download (WTI, CPI-Adjusted, Since 1986) Real WTI crude oil price, adjusted for US CPI inflation: monthly series since 1986 from EIA spot prices and BLS CPI. Mar 22, 2026
- CPILFESL: Core US CPI Inflation Excluding Food and Energy, Monthly Series Since 1957 CPILFESL monthly US Core CPI from FRED: ex food and energy, since 1957. Mar 17, 2026
Related topics
The subjects that most often intersect with this topic in our analyses.
Inflation114 pieces Inflation is a regime rather than a monthly print, and its persistence matters more than its level. 7 in common → Agriculture & Food25 pieces Agricultural prices are set less by how much the world grows than by where it grows it. 3 in common → Geopolitical Fragmentation7 pieces Geopolitics moves markets less through wars than through the trade routes, inventories and tariffs it redraws. 2 in common → Economic Cycles64 pieces A slowdown is not a recession, and quarterly headlines rarely reveal which phase the economy is in. 1 in common → Leading Indicators20 pieces A leading indicator is only as good as its record of false alarms. 1 in common → Metals & Critical Minerals46 pieces Gold answers to real rates, copper to industrial activity, uranium to power demand: each metal runs on its own driver. 1 in common →
This topic also exists in French.Énergie et pétrole, 24 pieces →