Pure-play refiners versus integrated majors: downstream margin exposure

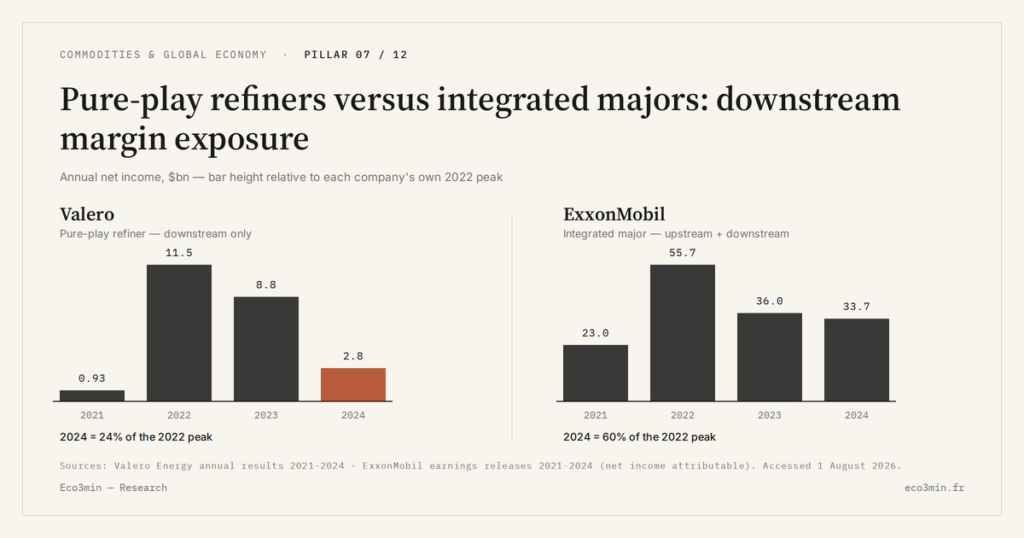
A pure-play refiner owns only the downstream, so its earnings track the refining margin. An integrated major also owns the upstream, which absorbs the cost of expensive crude and offsets the squeeze downstream.
Two companies process the same barrel yet do not carry the same risk. The difference rests on one thing: whether or not they own the oil production that sits upstream of refining.
On the refining margin, the pure-play refiner and the integrated major sit on opposite sides: one takes the crack in full, the other dilutes it upstream.
- Valero, a pure-play refiner, swung from an adjusted net loss of about $1.3bn in 2020 to a record $11.5bn net income in 2022, then $2.8bn in 2024 (Valero reports).
- At ExxonMobil, upstream supplied about two-thirds of 2022’s $55.7bn profit; in 2024, rising upstream (+$4.1bn) offset weaker refining margins (ExxonMobil results).
- The crack, not the crude price, sets the margin: an expensive barrel is a cost to the refiner and a revenue to an integrated major’s upstream.
A shorthand runs through every trading desk: oil stocks rise and fall with crude. On one specific point it misleads. The level of crude and the refining margin do not reward the same balance sheets, and two business models end up on opposite sides of that dividing line.
One figure makes the case. According to Valero’s full-year 2022 results, released in January 2023, net income attributable to stockholders reached $11.5 billion, against $930 million in 2021. No integrated major multiplied its profits at that pace over the same year. The reason is not that Valero refines better: it is that Valero only refines, and in 2022 refining paid as never before.
The mechanism: two opposite positions on the crack
The crack, or refining margin, is the gap between the value of refined products (gasoline, diesel, jet fuel) and the cost of the crude used to make them. That gap, not the absolute oil price, is what pays the transformation business. Reading it in detail is the job of how the 3-2-1 crack spread works, the sector’s reference measure.
A pure-play refiner, also called independent, owns the downstream only: it buys crude, processes it, sells products. Its income statement is, near enough, a direct read of the crack. When the margin widens, profits surge; when it narrows, they collapse, with no cushion.
An integrated major owns the whole chain, from the reservoir to the forecourt tank. Crude is no longer just a cost: it is also what the company extracts and sells. An expensive barrel penalises its refineries by inflating their feedstock, but it enriches its upstream in the same move. The two legs partly offset, and group earnings track the level of crude, through the upstream, more than the refining margin alone.
The numerical illustration is simple. A $10 rise per barrel lifts a refinery’s feedstock cost by the same amount; for a pure-play, that is a straight cost, recovered only if product prices follow. For the integrated group, those same $10 also inflate the value of every barrel pumped upstream. The cost line and the revenue line move together, and the group’s net sensitivity to the crude level shrinks accordingly. It is that internal symmetry that separates the two balance sheets, before any share price enters the picture.
Hence a simple opposition. The pure-play refiner takes the crack head-on; the integrated major dilutes it upstream. The same swing in margin does not carry the same weight depending on whether you own the barrel that enters the refinery.
Assuming that rising crude mechanically benefits refiners. Crude is their feedstock: a dearer barrel is first a cost. What a refiner captures is the crack, the gap between products and crude. Oil that climbs without the crack widening compresses a pure-play’s margin, at the very moment when an integrated major’s upstream, by contrast, gains from the pricier barrel.
The historical record: the 2022 peak and the 2024 normalisation
The 2022–2023 episode made the split visible to the naked eye. The crack hit highs, and pure-play operators posted record results. Beyond Valero’s $11.5 billion net income, its refining segment alone generated $15.8 billion of operating income in 2022, against $1.9 billion in 2021: an eightfold jump in twelve months, pulled up by the margin. The anatomy of that 2022–2023 refining golden age shows a stack of rare causes, with products suddenly scarcer than crude.
For the integrated names, the same record year tells a different story of composition. ExxonMobil reported $55.7 billion in net income for 2022, of which $36.5 billion came from upstream alone, about two-thirds of the total (full-year results, January 2023). TotalEnergies posted $36.2 billion of adjusted net income, with $7.7 billion from its Refining & Chemicals segment, roughly a fifth of the group (full-year release, February 2023). In both cases the downstream did benefit from the crack, but it was a minority slice of a result driven first by oil and gas.
In between, 2023 served as a landing. Valero’s net income came back to $8.8 billion, still high but already off the peak, as the crack deflated (Valero 2023 report). The decline was not a volume accident: across the period, Valero’s throughput stayed close to 3.0 million barrels per day. Volumes held while the margin did all the work, which isolates the crack as the single driver of the result.
The 2024 normalisation reversed the demonstration. Valero’s net income fell back to $2.8 billion and its refining operating income to $4.0 billion (2024 annual report). Over the same stretch, ExxonMobil posted $33.7 billion in earnings; upstream, at $25.4 billion (up $4.1 billion year-on-year), offset the retreat in refining margins (results release, January 2025). At TotalEnergies, Refining & Chemicals adjusted net operating income dropped to $2.2 billion, which the company attributed to lower margins in Europe (February 2025).
The amplitude gap reads in one line. Between 2022 and 2024, Valero’s profit fell by about three-quarters; ExxonMobil’s, by roughly 40% over the same period. The pure-play follows the margin in both directions; the integrated absorbs part of it on the way down as it had ceded part of it on the way up.
What integration covers, and what it does not
The integrated cushion has a precise direction. It works when the crack compresses while crude stays firm or rises: the upstream earns what the downstream loses. That is exactly the 2024 configuration, where the reward on oil supported integrated groups while the refining margin deflated. The drivers of refining margins and those of the crude price do not follow the same calendar, and it is that lag the integrated model exploits.
This internal hedge is not complete. An integrated group also carries chemicals, marketing and trading, which have their own cycles and can disappoint together. Marketing and trading, in particular, can smooth a weak refining year or deepen a bad one, depending on the cycle. Above all, the offset vanishes when crude and crack fall in unison: in 2020, the simultaneous collapse of prices and demand sank the whole chain, pure-plays and integrateds alike, with no leg catching the other. Integration smooths the crack cycle, not a general energy shock.
Still, the margin itself is set upstream of the balance sheet, by macro variables: available refining capacity, rationalised by closures since 2020, and product demand, sensitive to the economic cycle. A pure-play refiner’s earnings are therefore, in practice, an amplified exposure to the refining-capacity cycle. When capacity is tight and demand holds, that exposure pays; when either loosens, it reverses with the same force. The full map of those forces sits in how refining margins drive oil profits.
Frequently asked questions
What sets a pure-play refiner apart from an integrated major?
The pure-play runs the downstream only: buying crude, processing it, selling refined products. The integrated major adds the upstream (exploration and production) and often chemicals and marketing. The accounting consequence: the pure-play’s result tracks the refining margin, while the integrated’s tracks the level of oil and gas first.
Why do a pure-play refiner’s earnings vary more sharply?
Because no upstream offsets the crack. Valero’s record illustrates it: an adjusted net loss of about $1.3 billion in 2020, $11.5 billion of net income in 2022, back to $2.8 billion in 2024 (Valero reports). With no oil production on the books, the result tracks the products-minus-crude gap in full.
How does the crude level affect a refiner’s margin?
Crude is the refiner’s feedstock: a higher price raises the input cost. What pays the activity is the crack, the gap between product prices and crude. Oil that rises without products following at the same pace compresses that margin; an integrated major, by contrast, sees the same rise benefit its upstream.
At bottom, the pure-play refiner and the integrated major are not two bets on oil, but two opposite readings of the same barrel. The pure-play is a taut exposure to the margin cycle; the integrated smooths its extremes by owning crude on both sides of the meter. The distinction shows best when the crack hits a high or a low, precisely when the two models look least alike.
Last updated — 1 August 2026
Disclaimer – Financial Information: The analyses, commentary, and content published on eco3min.fr are provided for informational and educational purposes only. They do not constitute investment advice or a solicitation to buy or sell financial instruments. Past performance is not indicative of future results. All investment decisions involve risk and are the sole responsibility of the reader.
Read next
Full pillar →The 2022–2023 refining golden age: anatomy of an episode
In 2022, refined fuel prices climbed faster than crude. That gap, measured by the 3-2-1 crack spread, reached…
Diesel versus gasoline: why the two crack spreads diverge
The 3-2-1 crack blends gasoline and distillate into a single number, and that convenience hides something the market…
The 3-2-1 crack spread explained: refining margin in one formula
A refinery is, in the crudest terms, a spread trade: it buys crude oil, transforms it, and sells…