
The 2022–2023 refining golden age: anatomy of an episode

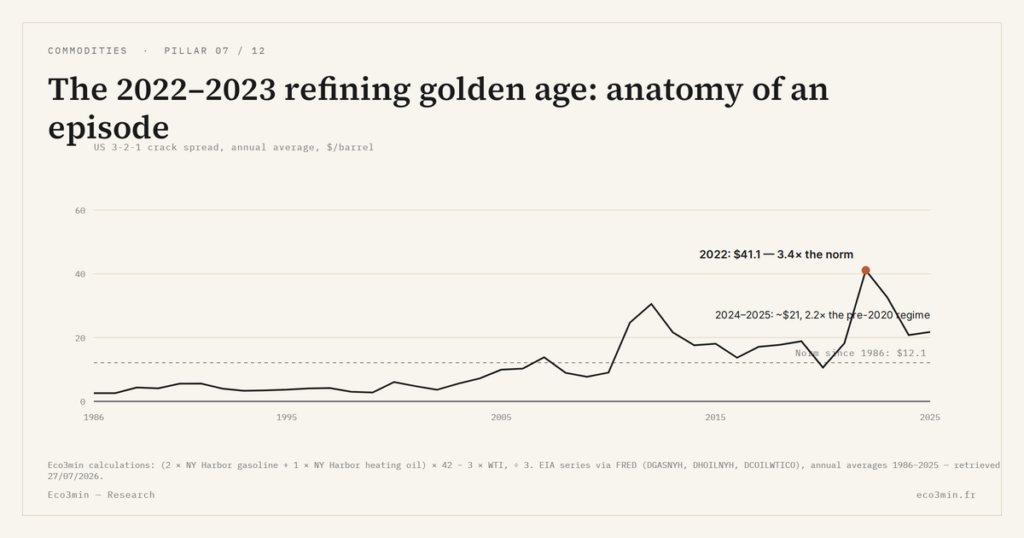
In 2022, refined fuel prices climbed faster than crude. That gap, measured by the 3-2-1 crack spread, reached an all-time high, briefly turning the downstream end of oil into the most profitable link in the chain.
A look back at a dated episode: what sent refining margins to a record between 2022 and 2023, and why the normalisation that followed is not a return to the old baseline.
The US 3-2-1 crack spread averaged $41/bbl in 2022, 3.4 times its since-1986 norm, an episode of product scarcity the barrel alone cannot explain.
- The series peaked at $71.7/bbl on 16 May 2022, with WTI near $114, the highest reading in almost four decades (Eco3min calculations on EIA/FRED price series).
- 119 days above $40/bbl in 2022, against 23 in 2023 and none in 2024: the strain concentrated first, then deflated.
- The pullback to $20.7/bbl in 2024 and $21.7 in 2025 still sits 2.2 times above the pre-2020 regime (around $9.5): the margin settled higher, it did not return to its old floor.
Downstream, long the poor cousin of the oil chain
The dominant reading files refining under thankless trades. High volumes, a thin conversion margin, a brutal cycle: value, the story goes, sits upstream, in owning the barrel, not in the downstream step that merely turns it into fuel. The 2010s confirmed the prejudice. Refining earned next to nothing.
That reputation was not unfounded. The 2010s brought waves of new refining capacity in Asia and the Middle East, while the US shale boom flooded the market with cheap light crude. Too much capacity for too little margin left the downstream structurally squeezed. Even in 2019 and 2021, the 3-2-1 crack held around $18/bbl, already above its long-run norm near $12, yet far from a regime of exceptional profits.
That hierarchy is why the refining margin stays under-watched even though it drives a large share of integrated majors’ profits, as set out in our analysis of why refining margins move oil-company profits. In 2022, for once, turning crude into fuel out-earned owning the crude.
What the 3-2-1 crack spread captured in 2022
The 3-2-1 crack spread is a simple convention (EIA): three barrels of crude yield, in approximation, two barrels of gasoline and one of distillate. The gap between the value of those products and the price of crude measures the gross conversion margin. The two-to-one gasoline-to-distillate ratio approximates the output of a typical US refinery; it ignores jet fuel and petrochemicals, which makes it a conventional, not exact, measure of the margin. You can track it directly through the daily 3-2-1 crack spread series, which runs back to 1986.
In 2022, two of its drivers jammed at the same time. Crude was expensive, with WTI above $114 in mid-May. Yet refined products were dearer still. US refining capacity had fallen through the pandemic (2020 and 2021 closures, documented by the EIA), fuel demand rebounded once lockdowns lifted, and distillate inventories were low. Russia’s invasion of Ukraine, on 24 February 2022, amplified the strain by disrupting Russian product flows and pushing operators to steer clear of them.
One piece of mechanics explains the violence of the shock. Shutting a refinery is usually permanent: sites idled during the pandemic did not reopen, and building new ones takes years. When fuel demand returned, product supply could not follow at the same pace, while crude stayed abundant. Hence the paradox the 3-2-1 captures: the binding constraint had moved from the well to the refinery. Expensive crude, even more expensive products, and a conversion margin that, for a moment, ruled. Who captured that margin is a separate question, and it turns on the downstream exposure that separates pure-play refiners from integrated majors.
The intensity concentrated into a few weeks. The monthly average crack peaked in May ($60.6/bbl) and June ($58.9), with 69 sessions above $50/bbl over the year, before an easing through summer and a rebound in October ($55.1). The 16 May high alone ran close to six times the long-run average of the series. Distillate led the move: scarcity hit diesel and heating oil first, which explains how diesel and gasoline cracks diverged over the period.
This technical detour has a direct macro reach. What a driver pays for is the refined product, not the barrel: when the crack widens, the increase passes through to the pump even if crude stabilises. In 2022, the surge in the refining margin therefore fed fuel inflation independently of the oil price, a channel the barrel-only reading leaves in its blind spot. Blind spots of that kind are frequent in sector analysis, and one of the most durable concerns why energy shares trailed the market through past transitions.
The $65.3/bbl spike on 20 April 2020 is not a golden age. That day, WTI settled at minus $36.98, in negative territory. Because the crack subtracts crude from the value of products, a collapsed barrel mechanically inflates the gap without any real margin exploding: it is an arithmetic artefact, not a profit boom. The genuine episode begins in 2022, when it is the products, this time, that turn scarce.
Three limits behind a record margin
The 2022 figure is striking, but three qualifications frame it, and none is minor.
First, the 3-2-1 is a gross margin, not a net profit. It subtracts crude from the value of products without deducting process energy, maintenance or fixed costs. Natural gas, the main fuel for refineries, was expensive in 2022, especially in Europe, where the spike raised the cost of running units at the very moment the gross margin was printing records. The gap between what the indicator showed and what a refiner actually banked widened accordingly.
Second, this crack is pinned to WTI, the US benchmark, which makes it sensitive to dislocations specific to that market. When WTI trades at a discount to global crude, for instance because of evacuation bottlenecks at Cushing during the shale boom, the 3-2-1 widens without any product scarcity behind it: the average margin had already reached $30.6/bbl in 2012, in a 2011 to 2013 stretch kept elevated for that reason. The lesson echoes 2020: a high crack does not always mean rich refiners. To tell them apart, the physical side matters, which is why reading refinery utilisation rates helps separate real tightness from arithmetic noise.
Third, the pullback is not a return to the old baseline. The shift did not happen at once: in 2023 the crack spent 165 sessions above $30/bbl but none above $50. The acute 2022 spike had drained away, the high plateau still held, at $32.7/bbl on average, close to three times the long-run norm. Then 2024 and 2025 brought the margin down to $20.7 and $21.7/bbl, 2.2 times the pre-2020 regime. Two readings coexist: a structurally higher plateau, because capacity retired since 2020 has not been replaced, or a normalisation simply left unfinished. The first half of 2026 leans toward the former: over the period run so far, ending in early July, the crack again hovers around $41/bbl.
An alternative reading deserves stating. Part of the 2022 margin may have owed less to a durable capacity shortfall than to a one-off demand catch-up after the pandemic, with fuel consumption returning all at once while supply stayed frozen. The 2024 and 2025 pullback seemed to validate that hypothesis; the first-half 2026 rebound undercuts it. The two forces, capacity constraint and demand swings, overlap without a price series alone being able to separate them. Where a price series stops short, the installed base still divides them: US operable capacity is higher today than in 1990 despite ninety permanent shutdowns, and the contraction is confined to the six years since the January 2020 peak, a distinction that the full record of US refinery shutdowns since 1990 turns on.
The 2022 golden age was therefore neither an isolated anomaly nor a permanent regime. Read through the 3-2-1, it reveals a refining margin that now oscillates around a higher level, punctuated by scarcity episodes that recur without settling in. The question is not whether downstream will turn thankless again, but how long a capacity shortfall can keep conversion more profitable than the resource itself.
Last updated — 3 September 2026
Disclaimer – Financial Information: The analyses, commentary, and content published on eco3min.fr are provided for informational and educational purposes only. They do not constitute investment advice or a solicitation to buy or sell financial instruments. Past performance is not indicative of future results. All investment decisions involve risk and are the sole responsibility of the reader.
Read next
Full pillar →IMO 2020: the regulatory shock that rewrote product spreads
An environmental rule on marine sulfur can move a refining spread more than a swing in crude. IMO…
Diesel versus gasoline: why the two crack spreads diverge
The 3-2-1 crack blends gasoline and distillate into a single number, and that convenience hides something the market…
The 3-2-1 crack spread explained: refining margin in one formula
A refinery is, in the crudest terms, a spread trade: it buys crude oil, transforms it, and sells…


