French Mortgage Usury Rate: The Hidden Credit Lock
How the French mortgage usury rate reshapes access to credit in 2026, compresses bank margins and conditions purchase or investment decisions.

How the French mortgage usury rate is reshaping access to credit in 2026, bank margins, and your purchase or investment decisions.
TL;DR
In France, the usury rate caps the all-in APR (TAEG), including insurance, fees and guarantees; this regulatory ceiling silently filters out solvent borrowers whose headline rate alone would qualify.
- Because the cap applies to the total financing cost, costlier insurance for borrowers over 50, health surcharges and non-linear incomes can push a file past the limit even within the 33–35% debt-to-income ratio.
- With 20-year mortgage rates around 3.8–4.4% in 2026 and bank refinancing costs still elevated, the cap compresses lending margins and acts as a credit tightening without any further policy-rate hike.
Mortgage usury rate: a regulatory cap back at the centre
In 2026, with mortgage rates stabilising around 3.8–4.4% on 20-year loans depending on the area, one phenomenon persists: solvent loan files are blocked not by the bank itself but by the usury rate.
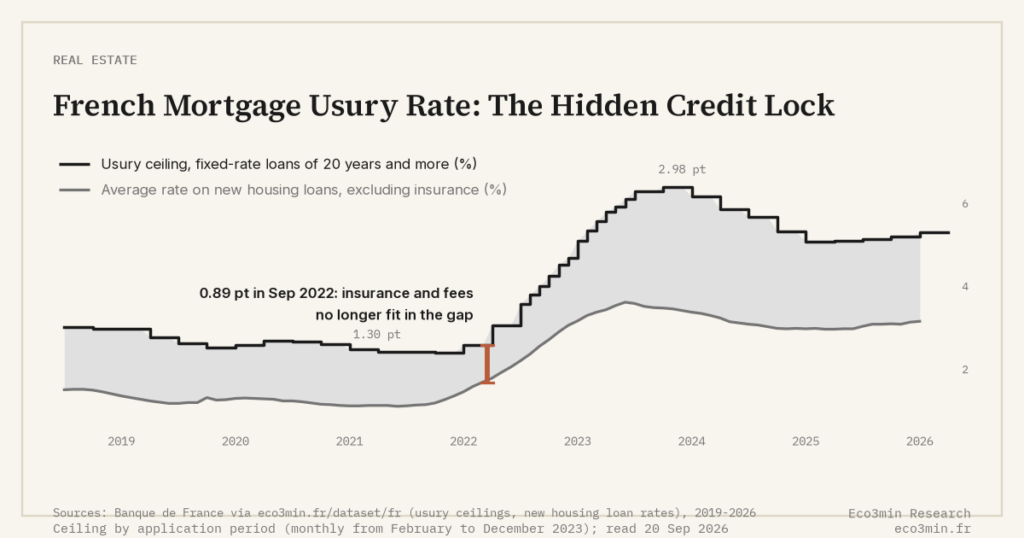
This regulatory cap, calculated from average market rates marked up by a statutory margin, sets the maximum allowable APR (TAEG). It acts as a silent filter in an environment of rates durably higher than between 2015 and 2021.
To frame this mechanism in a broader reading, it should be placed within the framework of real estate cycles and interest-rate regimes. The usury rate is not an administrative detail: it conditions the volume of credit that can actually be distributed.
Technical recap: what the usury rate actually covers
The usury rate applies to the APR (TAEG), which includes:
- the loan’s nominal rate;
- file fees;
- guarantees (mortgage, surety);
- borrower insurance cost.
Key point: it is not the headline rate that is compared to the cap, but the full financing cost. The headline rate is itself a published series, the Banque de France MIR rate on new fixed-rate housing loans, measured on loans actually signed.
In an environment where central banks maintain still-elevated policy rates (roughly 2.5–3.5% across regions) to anchor inflation, banks’ refinancing cost remains higher than during the previous decade. This mechanically reduces the available margin under the regulatory cap.
What is actually blocking files in 2026
The issue is no longer a rapid surge in rates but the stacking of costs:
- more expensive insurance for profiles over 50;
- health surcharges;
- elevated guarantee fees;
- non-linear incomes (self-employed, freelancers).
The result: borrowers within the debt-to-income ratio (roughly 33–35%) can still exceed the usury rate by a few tenths of a point.
Economic mechanism: compression of bank margins
The usury rate effectively functions as an overall margin ceiling:
- refinancing cost (linked to money-market and bond yields);
- insurance cost;
- commercial margin and bank risk premium.
If the refinancing cost remains elevated and the regulatory cap does not move as quickly, the bank margin shrinks. Two consequences:
- tighter borrower selection (high down payment, permanent contract, low risk);
- progressive exclusion of low-net-yield rental projects.
At the macro level, this filtering acts as a credit tightening, even without further policy-rate hikes. As detailed in our analysis of the mortgage credit cycle, the financing constraint ultimately weighs on volumes, then on prices.
Three scenarios for 2026–2027
1. Gradual stabilisation
Inflation contained, modest monetary easing. Mortgage rates ease back toward 3.5–4%. The usury rate follows, and most files come back below the cap.
2. Durable plateau
Policy rates kept around 3%. Mortgage rates remain near 4–4.5%. The usury rate continues to act as a structural filter, particularly for:
- seniors;
- self-employed borrowers;
- highly leveraged investors.
3. New bond market tension
European long yields move back above 4%. Lending rates rise faster than the regulatory cap, creating a temporary mismatch. Transaction volumes contract more sharply than prices.
Common reading errors
- Looking only at the headline rate. It is the APR (TAEG) that determines whether the file passes under the cap.
- Confusing a falling usury rate with easier credit. If banks remain cautious, selection persists.
- Assuming a high income is enough. Insurance can push the APR above the threshold.
Technical levers used to stay under the cap
- Optimising insurance (delegation, competitive bidding).
- Adjusting loan duration after a precise simulation of the total APR.
- Strengthening the down payment to reduce perceived risk and the required margin.
KPIs to track
- Spread between average lending rates and the usury rate.
- 10-year sovereign bond yields.
- Refusal rates linked to APR breaches.
The narrower the spread between practised rate and usury rate, the higher the probability of files being blocked.
Implications by profile
Buy-to-let investors: empirically, projects whose net yield exceeds total credit cost by at least 2 points have shown a wider buffer against regulatory risk and vacancy.
Real estate corporates: integrating the usury rate into pipeline forecasts and segmenting offers by effective client solvency has been observed in recent years as a way to limit slippage between signed pre-sales and final loans.
Households: historically, files arbitrated when the spread between practised rates and the usury rate is widest have shown a higher pass-through rate than those targeting only “the lowest rate”.
3 takeaways
- The mortgage usury rate applies to the total APR (TAEG), not the headline rate alone.
- In a world of durably higher rates, it acts as a structural filter on credit access.
- Tracking the gap between market rates and the usury rate provides a simple indicator of borrowing windows.
The usury rate is neither a mere safeguard nor a one-off obstacle: it reflects the scarcity of capital in a normalised rate regime. Scarcity of capital priced through the usury cap runs straight into the mortgage-capacity mechanism, where rates set what a household can buy. Borrowers who integrate this constraint upstream tend to structure more robust projects than those who discover it at the moment of bank refusal. Related reading: the Eco3min framework on the real estate credit cycle and its price dynamics.
Last updated — 20 September 2026
Disclaimer – Financial Information: The analyses, commentary, and content published on eco3min.fr are provided for informational and educational purposes only. They do not constitute investment advice or a solicitation to buy or sell financial instruments. Past performance is not indicative of future results. All investment decisions involve risk and are the sole responsibility of the reader.
Read next
Full pillar →US Rental Property Real Yield: What Cap Rate and NOI Actually Leave You
A rental listing leads with a yield. Divide the annual rent by the price and the number looks…
Cap Rate Spread: What Rental Yield Pays Over the 10-Year Treasury
A 5% cap rate sounds attractive. But 5% against what? A risk-free 10-year Treasury yields near 4.5% in…
Vacancy and Turnover: The Cost That Erodes a Landlord’s Real Return
A listing shows full rent, twelve months a year. The owner knows the gaps between tenants, the make-ready…