
The Global Wheat Market: Breadbaskets, Exporters and Dependent Importers

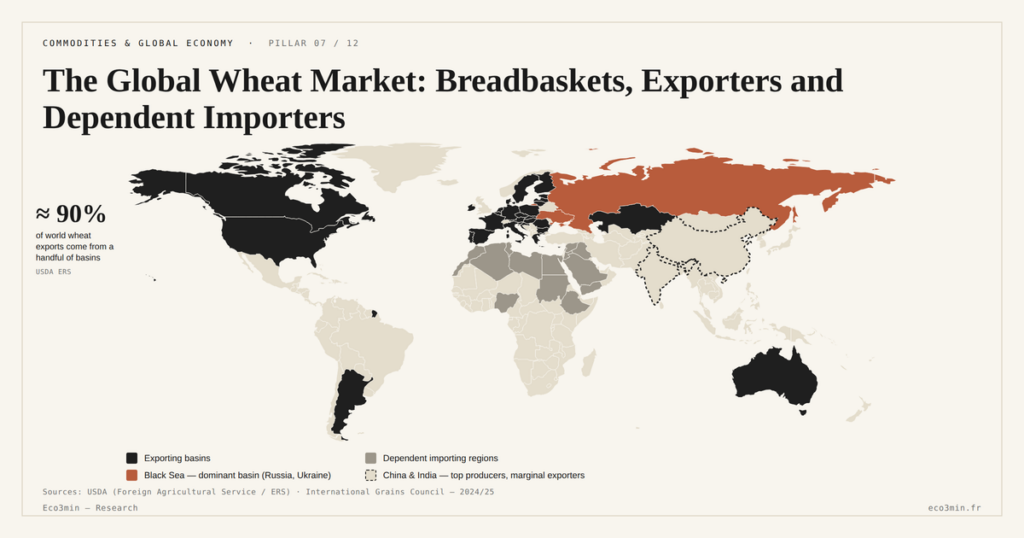
World wheat trade rests on a small number of exporting basins, while a long list of importing countries depend on them to feed their populations. This asymmetry between concentrated supply and dispersed demand shapes the entire market.
TL;DR
World food security rests on a few trade lanes, from the Black Sea and North America to North Africa and the Middle East, so disruption falls on the same importers.
- These lanes mirror the concentration of supply: a handful of routes carry the wheat feeding the most dependent countries, so a shock recurs predictably on the same importers rather than landing at random.
- The exporter club is narrow: the Black Sea (Russia leading, USDA 2024), North America, the EU, Australia and Argentina, while the largest producers, China and India, export little because their harvests feed domestic markets first.
This article maps the geography of wheat — who grows it, who exports it, who relies on it — as the prerequisite to reading any food crisis. Vulnerability is written into the map first.
Wheat is the world’s most traded grain, yet its production and trade rest on a handful of countries. A few basins supply most of global exports, while a long list of importers across North Africa, the Middle East and sub-Saharan Africa depend on them for the staple diet of their populations (USDA; International Grains Council, 2024). Understanding this architecture is the prerequisite to any analysis of shocks: it determines where a supply incident turns into tension, as the reading of wheat as a barometer of stability makes clear.
A handful of exporting breadbaskets
Exportable wheat supply concentrates in a small number of regions. The Black Sea zone — Russia and Ukraine — has established itself as a decisive supplier over the past two decades, with Russia now ranking as the leading world exporter (USDA, 2024). North America, with the United States and Canada, remains a historic pillar of the market, followed by the European Union, Australia, Argentina and, more recently, India in certain seasons. This club of exporters is narrow, and it is on it that the share of world wheat genuinely available for international purchase depends.
Each of these basins carries a distinct risk profile. The Black Sea combines competitiveness with exposure to political and climatic hazard, which makes it both the engine of recent abundance and the system’s point of fragility; this concentration is analysed in detail through the Black Sea breadbasket. North America and the European Union offer greater institutional predictability but higher production costs. Australia and Argentina, in the southern hemisphere, offset their harvests against the northern calendar, which can cushion certain seasonal deficits — a balancing factor often underrated in reading the world supply schedule.
The diversity of these origins is, in theory, a protection: if a harvest fails in one basin, others can partly compensate. But that protection has eroded as the relative weight of the Black Sea has grown. The larger the share of exportable supply that flows through a single region, the weaker the capacity for substitution, and the more a localised shock weighs on the world price. The map of exporters is therefore not a simple geographic inventory: it describes the market’s degree of resilience to a supply disruption.
The narrowness of this exporter club is not fixed. The map has been reshaped over two decades, the rise of the Black Sea shifting the market’s centre of gravity toward a more recent and institutionally less-tested region. This shift added supply and lowered prices, but it also made the market more sensitive to the decisions of a small number of actors. Conversely, the exit or temporary weakening of a major exporter — through drought, frost or political restriction — leaves a gap that other basins do not always fully fill in the short run. The composition of the exporter club thus determines the depth of the market: a broad, diversified club absorbs shocks, a narrow, concentrated one transmits them. It is this composition, as much as the total volume produced worldwide, that sets the margin of safety available to international supply. The predictability of these countries’ trade policies matters as much as their volumes: an abundant but unpredictable exporter offers less supply security than a more modest but stable one, because the market values the reliability of flows as much as their size.
Producing is not exporting
The map of production differs deeply from the map of exports, and conflating the two leads to misreading the market. The two largest wheat producers in the world — China and India — do not, in normal times, rank among the major exporters. Their harvests, sizeable as they are, are almost entirely consumed within their borders to feed immense populations. A massive output can therefore coexist with a marginal presence on the international market.
This dissociation has a direct consequence for price formation. The world market covers only the exportable share of production, that is, the surplus a country generates once its domestic consumption is met. This surplus is not only a minority of the total harvest but also more geographically concentrated than production itself. Market power is therefore measured not by the size of the harvest, but by the capacity to generate and sell a surplus — a capacity held by an even narrower circle than that of the large producers.
It is often assumed that the largest wheat producers are also the largest exporters. This is misleading: China and India produce enormous volumes but export little, because their harvests feed their domestic markets first. The world price depends on the exportable surplus, which is more concentrated than production.
The thinness of the exportable surplus has a consequence that production figures alone do not reveal: the international wheat market is a thin market. Because it covers only the sellable fraction of the harvest, even a modest imbalance between exportable supply and demand is enough to trigger a marked price adjustment. Where a deep market dampens swings through its volume, a thin one amplifies them. This feature explains why wheat can see price moves out of all proportion to the change in world production: it is not the total harvest that sets the price, but the precarious balance of its tradable share. The thinness of the market also makes it more reactive to news and expectations: an announcement of a poor harvest or an export restriction produces a sharper price effect than on a deep market, because operators adjust their positions on a narrow base. The distinction between producing and exporting is therefore not a statistical subtlety but the key to the market’s volatility and to the speed with which a scarcity signal forms.
This finding also illuminates the particular position of net exporting countries. Their influence on the market stems from feeding world demand beyond their own needs, which gives them a power of arbitrage: a decision to restrict sales to protect the domestic market withdraws supply available to others. This dynamic specific to producing countries appears across all commodities, as detailed in the weight of producing countries; wheat offers a version in which the stake is not only economic but alimentary and social.
The map of dependence
On the reverse side of concentrated supply lies a dispersed and, in part, structurally dependent demand. Several regions import a large share of the wheat they consume, lacking sufficient local production. North Africa, Egypt, the Near and Middle East and part of sub-Saharan Africa are among the most exposed zones, with often high per-capita consumption and a largely external supply (International Grains Council, 2024).
This dependence has a logistical as much as an economic dimension. Imported wheat must travel thousands of kilometres from exporting basins to consuming ports, which adds a freight cost to the world price and exposes flows to sensitive maritime passages. The distance between breadbaskets and consuming nations thus shapes trade routes, costs and vulnerability to disruption: a shock in a strait or a port can raise the cost of supply well beyond the effect of the world price alone. This geography writes dependence into territory before it writes it into price, a frame extended by agricultural commodities overview.
This dependence is not the product of chance but of durable physical constraints. The most import-reliant regions often combine an arid or semi-arid climate, limited water availability and arable land insufficient for their populations, all of which cap local grain production. Where demography grows faster than agricultural capacity, the gap between consumption and production widens mechanically, and importing becomes a structural necessity rather than a cyclical choice. This dependence is therefore long-lasting: it does not dissolve with the harvest cycle but follows from geographic and demographic conditions that change slowly. The demographic trajectory even tends to deepen it, since a growing population raises food needs while cultivable land and water remain constrained. This is what makes these countries durably sensitive to swings in the world market, and what places food security at the heart of their budgetary and political balances, well beyond a mere import line.
Exposure is not uniform. It depends on the share of needs covered by imports, the budgetary capacity to cushion increases through subsidies, the strength of the currency against the invoicing currency and the weight of food in household budgets. The same world price therefore hits countries very differently, which explains why the map of dependence, more than the level of the price, determines where a spike turns into tension. Reading the wheat market means overlaying these two maps — concentrated supply and dependent demand — because it is at their intersection that the sharpest food risks lie.
Overlaying the two maps reveals a further point: the world’s food security does not rest on a diffuse web of trade but on a limited set of corridors linking specific exporting basins to specific importing regions. A large share of the wheat that feeds the most dependent countries follows a handful of recurring routes, from the Black Sea and North America toward North Africa and the Middle East. This concentration of trade lanes mirrors the concentration of supply: it means a disruption is rarely random in its impact, but falls predictably on the same importers along the same routes. The geography of dependence is, in this sense, not only a map of who imports, but a map of which lanes carry the risk — and those lanes are fewer than the diversity of producing and consuming countries would suggest.
The geography of wheat is therefore not a neutral backdrop but a structure of risk. An exportable supply tightened onto a few basins, a clear distinction between production and sellable surplus, and a dispersed but dependent demand: these three traits define the conditions under which a supply shock propagates. It is on this map that past episodes are read and future vulnerabilities take shape.
Last updated — 28 June 2026
Disclaimer – Financial Information: The analyses, commentary, and content published on eco3min.fr are provided for informational and educational purposes only. They do not constitute investment advice or a solicitation to buy or sell financial instruments. Past performance is not indicative of future results. All investment decisions involve risk and are the sole responsibility of the reader.
Read next
Full pillar →Reading the refinery utilisation rate: the threshold, the season, the turnarounds
A refinery runs full near ninety percent, not a hundred: the last slice of nameplate capacity is a…
IMO 2020: the regulatory shock that rewrote product spreads
An environmental rule on marine sulfur can move a refining spread more than a swing in crude. IMO…
The 2022–2023 refining golden age: anatomy of an episode
In 2022, refined fuel prices climbed faster than crude. That gap, measured by the 3-2-1 crack spread, reached…


