How Productivity Shapes the Business Cycle
Labour productivity growth in G7 economies halved between 2015-2025 (0.8% per year) versus the previous decade (1.5%) — a regime change, not a cyclical dip. With weaker productivity, growth has to be built from debt and labour input, and the cycle becomes structurally more fragile to shocks.

Productivity gains do not diffuse instantly or evenly across sectors. Their lagged spread reshapes capital returns, margin structure and growth trajectories — and explains why the post-2015 slowdown matters more than its headline number suggests.
TL;DR
Productivity sets how fragile a cycle is: G7 labour-productivity growth averaged 0.8% a year over 2015-2025, half the previous decade, pushing expansions to lean on debt and labour input. For the raw figures, see our US unit labor costs dataset.
- Weak productivity forces growth onto debt and labour input, the configuration of most G7 economies since the mid-2010s, and shrinks the cushions a cycle needs to absorb shocks.
- A feedback loop takes hold: lower expected returns on capital cut investment, slower capital-per-worker growth feeds back into weaker productivity, the signature of an underinvestment regime.
- Quarterly prints mislead: US nonfarm productivity rose 2.2% year-on-year in Q3 2025, above trend, but alongside a hiring freeze, output-per-worker rising because headcount fell faster than output.
- AI is the open variable: IMF and Goldman Sachs Research project 1 to 1.5 points a year of added productivity on broad diffusion, though past technological shifts took 10 to 20 years to show in aggregate statistics.
Productivity is usually analysed as a long-run variable, disconnected from cyclical fluctuations. In practice, its dynamics shape every phase of the cycle. When gains accelerate, investment becomes profitable and expansion extends. When they stall, growth has to be built from leverage and employment instead — and that mix is structurally more fragile.
Treating productivity as exogenous to the cycle is an analytical convenience that fails at every turning point. Rising productivity lifts the marginal return on capital and stretches expansions; stagnant productivity forces the economy to lean on debt and labour input, which is precisely the configuration in which most G7 economies have operated since the mid-2010s. The framework for reading real business cycles places productivity at the centre of the diagnosis, not at the margin. Related explainer: how credit and business cycles diverge.
The decade is unambiguous in the numbers. The OECD estimated in November 2025 that labour productivity growth in G7 economies averaged 0.8% per year over 2015-2025, against 1.5% over the previous decade. A halving — observed under conditions of unprecedented monetary accommodation and large fiscal stimulus packages. The slowdown is not cyclical. It is the regime.
A silent slowdown that weighs on every phase of the cycle
The 0.8% number is the headline; the implications run deeper. A persistently lower productivity trend reduces potential growth and the economy’s capacity to absorb shocks, compresses corporate margins at constant cost levels, and limits real wage gains except through credit. Each of these channels changes how the cycle behaves: smaller cushions, narrower buffers, faster transmission of negative shocks into household and corporate balance sheets.
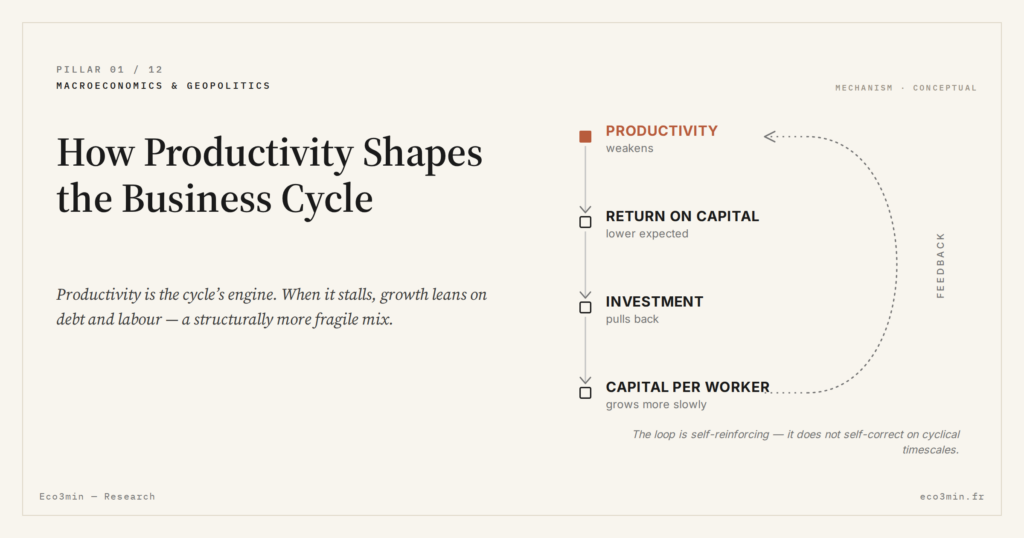
The real business cycle, anchored in investment and capital allocation, takes the brunt of this. Lower productivity means lower expected returns on new capital. Lower expected returns mean less investment. Less investment means the capital stock per worker grows more slowly, which feeds back into still-weaker productivity. This feedback loop is what underinvestment regimes look like in practice — and it is not self-correcting on cyclical timescales.
The composition trap: apparent gains that are not gains
Productivity is not constant across the cycle, and reading it requires distinguishing between mechanical and structural movements. In expansions, productivity tends to accelerate as firms use existing capacity more fully and recent investments come online. In slowdowns, apparent productivity can rise — but for a very different reason: firms cut employment faster than output, which mechanically lifts output-per-worker without any genuine efficiency gain. Until the measurement convention is fixed, the comparison with pay stays undetermined: four conventions frame the US productivity-pay gap, on one and the same BLS series.
The US Bureau of Labor Statistics reported a 2.2% year-on-year rise in nonfarm productivity in Q3 2025, above the long-run trend. The same quarter saw a hiring freeze across several sectors. Firms produced more per worker not because of innovation or capital deepening, but because the workforce was being compressed faster than the output line. Long-term industrial cycles remind us that genuine productivity gains are measurable over multi-year horizons — not from a quarterly print captured in the middle of a labour adjustment.
Reading a quarterly rise in labour productivity as the announcement of a structural pickup. In slowdown phases, apparent productivity can rise simply because headcount falls faster than output. This is a composition effect, not an efficiency gain, and it reverses as soon as the labour market reaccelerates. Distinguishing the two requires looking at total factor productivity rather than output-per-worker, and at multi-quarter trends rather than single prints.
Whether artificial intelligence breaks this regime is the open question. IMF and Goldman Sachs Research estimates project productivity gains of 1 to 1.5 percentage points per year if AI diffuses broadly across services. The qualifier matters: the diffusion depends on human capital investment, digital infrastructure and regulatory adaptation, none of which are in place at scale. The structural dynamics of the cycle show that technological revolutions historically take 10 to 20 years to translate into aggregate productivity statistics. The current numbers will not move in 2026 or 2027, whatever the AI narrative looks like by then.
Last updated — 10 September 2026
Disclaimer – Financial Information: The analyses, commentary, and content published on eco3min.fr are provided for informational and educational purposes only. They do not constitute investment advice or a solicitation to buy or sell financial instruments. Past performance is not indicative of future results. All investment decisions involve risk and are the sole responsibility of the reader.
Read next
Full pillar →Monetary Tightening: How Central Banks Are Reshaping Financial Markets
After more than a decade of ultra-accommodative policy, monetary tightening has reintroduced the real cost of capital as…
Hidden Unemployment: Reading the Real Labor Market in 2026
Headline unemployment is stabilizing while broad underemployment still runs above pre-2020 levels. Reading the gap between official rates…
2026 Economic Outlook: Key Trade-Offs After the End of Cheap Money
2026 ushers in a more constrained macro regime where real rates stay positive, fiscal space narrows and geoeconomic…