Real Estate Leverage Under Monetary Tightening: Why Debt Changes the Risk Reading
Mortgage-financed real estate is not an ordinary asset. Under monetary tightening, leverage amplifies risk and reframes the patrimonial reading. Real cost of debt and illiquidity, not headline mortgage rates, become the central variables.

Mortgage-financed real estate is not an ordinary asset. Under monetary tightening, leverage amplifies risk and reshapes patrimonial analysis.
Updated July 2026: figures on the real cost of mortgage debt, the ECB policy rate and the 10-year OAT have been revised against primary sources (Banque de France / ECB MIR, Insee, Eurostat, ECB).
TL;DR
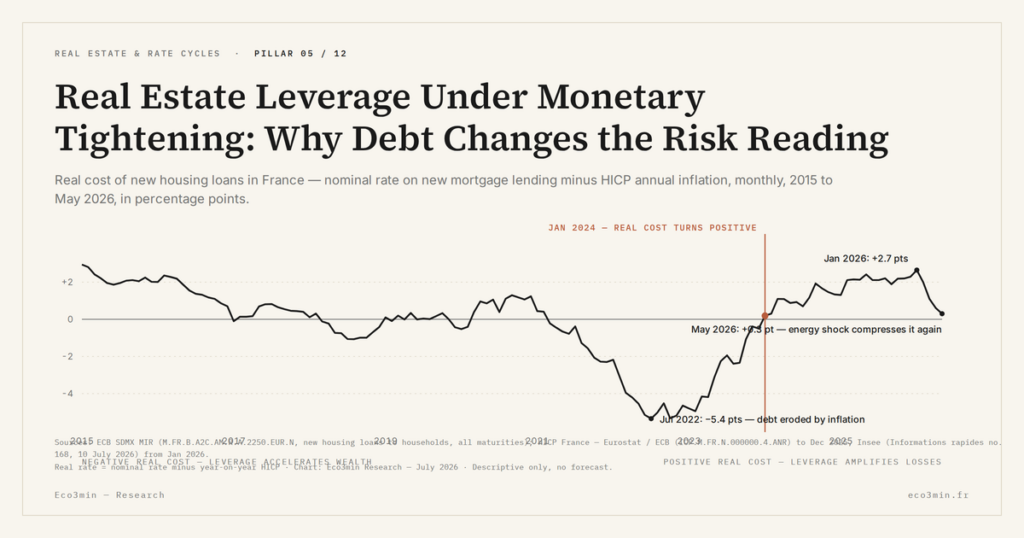
Mortgage-financed property behaves like a leveraged asset: what governs its risk is not the headline mortgage rate but the real cost of debt — and that cost has swung from about -5.4 points in 2022 to +2.7 points in January 2026, before the 2026 energy shock compressed it back to +0.3 point in May.
- On a 300,000€ home bought with a 60,000€ down payment (leverage of 5), a 10% price fall of 30,000€ erases half the equity, whatever reputation for safety the asset carries.
- The real cost of new mortgage debt in France — the nominal rate on new housing loans minus French HICP inflation — averaged about +0.5 point over 2015-2021, fell to roughly -5.4 points in July 2022 as inflation peaked, and returned durably above zero in January 2024 (ECB MIR; Insee/Eurostat HICP).
- Volumes broke before prices: existing-home transactions fell from over 1.1 million to about 870,000 between Q1 2022 and end-2023 (Notaires de France), with prices off 4.2% year-on-year by February 2024 and up to 7% in the Paris region.
- Mid-2026 the picture shifted again: French HICP inflation rebounded from +0.4% in January to +2.8% in May before easing to +2.0% in June (Insee), the ECB raised its deposit rate from 2.00% to 2.25% on 17 June 2026, and the 10-year OAT stood at 3.68% in June — with the mortgage rate near 3.10%, the real cost of debt is back close to zero.
Between Q1 2022 and end-2023, the volume of existing-home transactions in France fell from more than 1.1 million to roughly 870,000, according to Notaires de France — a contraction of about 22% in less than two years. Prices followed with a lag: -4.2% year-on-year at end-February 2024 nationally, and as much as -7% in the Paris region. This is not a demand crisis in the conventional sense. It is the direct manifestation of a monetary regime shift on an asset structurally financed by debt. The mechanism through which rate shocks transmit to prices with a lag is documented in our analysis of the delayed reaction of real estate prices.
The dimension often overlooked in real estate analysis comes from this singularity: residential real estate is, for the vast majority of households, a leveraged asset. And leverage is not a mere financing tool. It is a cycle amplifier whose behaviour changes radically depending on the prevailing rate and liquidity regime — a central point for understanding why real estate prices rise and fall.
Real estate as a leveraged asset: what changes with debt
Buying property with a mortgage means taking exposure to changes in the value of an asset with capital committed below that value. A household buying a home worth 300,000 euros with a 60,000-euro down payment and 240,000 euros of debt operates with a leverage ratio of 5. A 10% decline in the value of the property — 30,000 euros — translates into a 50% loss relative to the initial down payment. Leverage amplifies gains in upward phases. It amplifies losses just as much in downward phases.
This mechanic is well known in financial markets. It is rarely made explicit in the real estate context, where the dominant perception associates property with safety. Yet what determines the real risk of a leveraged asset is not the nature of the underlying asset, but the cost of debt and the liquidity of the market in which that asset trades. Related question: commercial real estate as a systemic risk.
Three parameters whose nature shifts with the cycle
The real cost of debt. The relevant measure is not the advertised mortgage rate but that rate net of inflation. Between 2015 and 2021, the average rate on new housing loans in France stood at about 1.6% (ECB MIR statistics, all maturities), against French HICP inflation averaging close to 1%. The real cost of borrowing was therefore low — around +0.5 point on average — and dipped below zero only episodically, in 2016-2017, in 2018 and again in 2021. Leverage acted as a mild wealth accelerator: debt eroded slowly in real terms while real estate prices rose, lifted by the compression of required yields.
The deeply negative phase came later, and it came with the inflation shock rather than before it. In July 2022, with French HICP inflation at 6.8% and mortgage rates still near 1.4%, the real cost of mortgage debt reached roughly -5.4 points: existing borrowers saw the real burden of their debt erode faster than at any point in the previous decade. The monetary tightening initiated by the ECB in July 2022 then reversed the logic. The average rate on new housing loans rose from about 1.1% at end-2021 to 3.60% in December 2023 on the ECB’s all-maturities measure — market rates on twenty-year loans went past 4% — and inflation fell back. According to the Banque de France, the average rate granted in November 2025 stood at 3.01%. With French HICP inflation down to +0.7% in December 2025 and +0.4% in January 2026 (Insee), the real cost of mortgage debt peaked at about +2.7 points in January 2026. Leverage, in that regime, no longer reduces the real cost of borrowing. It increases it. For the broader picture: our reference page on the real estate credit cycle and its price dynamics.
That configuration did not last six months. The energy price surge of spring 2026 — energy up 11.0% year-on-year in June, petroleum products up 19.7% (Insee) — pushed French HICP inflation from +0.4% in January to +2.8% in May, before it eased back to +2.0% in June. With the rate on new housing loans stable near 3.10%, the real cost of mortgage debt fell from +2.7 points in January 2026 to about +0.3 point in May. The lesson is not that the tightening has been undone: it is that the variable which governs the sign of leverage is volatile, and that a borrower’s real position can change by two full points in a single quarter without any move in the advertised mortgage rate.
The stickiness of adjustments. Unlike financial assets, real estate does not reprice continuously. Prices respond with a structural lag of six to twelve months to changes in monetary conditions. Volumes collapse before prices fall — exactly what played out in France between mid-2022 and end-2023. This viscosity creates a trap for indebted owners: the book value of the debt stays fixed while the market value of the property adjusts slowly downward.
Illiquidity is the most underestimated risk in real estate. A financial asset can be sold in seconds. A property takes several months to sell in a falling market. This asymmetry between the liquidity of the debt — monthly instalments are due every month — and the illiquidity of the asset constitutes the structural fragility of real estate leverage during tightening cycles.
Origination conditions as a cycle variable. Real estate leverage does not depend on the rate alone. It depends on access to credit itself. In France, the Haut Conseil de stabilité financière (HCSF) rules, in force since 2021, cap the debt-service-to-income ratio at 35% of net income. That constraint, combined with a down-payment requirement on average 46% higher at end-2025 than in 2019 according to the Observatoire Crédit Logement/CSA, changes the nature of access to leverage depending on the phase of the cycle. In a low-rate regime, HCSF rules rarely bind. In a high-rate regime, the same cap excludes a growing share of households. Monetary tightening therefore acts twice: it raises the cost of existing leverage, and it reduces access to new leverage. This double effect explains why housing market dynamics do not respond linearly to rate changes, and why the analysis of rates and purchasing power cannot be limited to the headline mortgage rate. Companion analysis: the refinancing channel behind REITs.
Comparing the gross rental yield of a property with the yield of a financial asset without factoring in leverage. A 4% rental yield with leverage of 5 does not produce the same risk profile as a 4% bond. The relevant yield is the return on equity, adjusted for the cost of debt and illiquidity.
What the current regime means for reading leverage
Through 2025 the French real estate market stabilised after two years of correction: transactions rebounded to roughly 945,000 over twelve months, prices showed a modest gain of +0.5% to +0.7% year-on-year according to Notaires de France, and mortgage rates settled around 3% to 3.3% on twenty-year loans. Neither a crisis nor a rebound — a fragile equilibrium regime, in which leverage operates under conditions markedly different from those of the previous decade. The macroeconomic cycle diagnostic helps situate this transition phase precisely.
The first half of 2026 reopened the question. Mortgage origination grew by 35 to 40% in volume in 2025 but remains below pre-crisis levels, and the financing backdrop has hardened rather than eased: the 10-year OAT rose from 3.56% in December 2025 to 3.68% in June 2026, a level that constrains bank margins and limits any decline in mortgage rates. Above all, the ECB — which had held its deposit facility rate at 2.00% since June 2025 — raised it to 2.25% on 17 June 2026 in response to the inflation rebound, ending the assumption of a policy rate frozen through the year. A return to the financing conditions of 2015-2021 is not on the table. The framework for reading monetary policy and rate transmission becomes an indispensable analytical tool for situating the phase in which real estate leverage operates.
Why real estate does not compare with financial assets
The temptation to compare real estate directly with equity or bond markets glosses over three structural differences. Illiquidity, first. Indivisibility, next: a stock portfolio can be reduced gradually, a property cannot be sold in slices. The use dimension, finally: a home occupied by its owner produces an implicit return — the rent saved — that makes the patrimonial decision inseparable from the housing decision.
Understanding the interactions between the macroeconomic regime, rate transmission and mortgage credit behaviour requires a reading that goes beyond simply tracking headline rates. It is in the dynamics of leverage — its real cost, its accessibility, its rigidity — that the real analysis of real estate risk plays out during a monetary transition.
Real estate risk lies not in price variation but in the interaction between leverage, the real cost of debt and the illiquidity of the asset — a combination whose behaviour shifts in nature with the monetary regime, and which can change sign faster than the mortgage rate itself.
- Residential real estate is a leveraged asset whose risk profile depends on the real-rate regime, not on the headline mortgage rate.
- The real cost of mortgage debt in France was mildly positive over 2015-2021 (about +0.5 point on average), fell to roughly -5.4 points at the July 2022 inflation peak, and returned durably above zero in January 2024.
- Real estate illiquidity creates a structural asymmetry with debt liquidity: monthly instalments are due every month, but selling the property can take months.
- In mid-2026 the real cost of debt narrowed sharply again — from +2.7 points in January to about +0.3 point in May — driven entirely by the inflation rebound, while the ECB moved its deposit rate up to 2.25% in June. The variable that governs leverage is now moving faster than the mortgage rate.
The French real estate market enters the second half of 2026 in an in-between zone: neither the exceptional conditions of the low-rate decade, nor the abrupt contraction of 2023. For households assessing their borrowing capacity and for investors thinking in terms of return on equity, the decisive variable is no longer the price per square metre, nor even the advertised mortgage rate. It is the real cost of that rate in the macroeconomic regime in force — and the speed at which that regime can change.
Sources: ECB MIR statistics (M.FR.B.A2C.AM.R.A.2250.EUR.N, new housing loans to households, France); Insee, Informations rapides no. 168, 10 July 2026 (HICP France); Eurostat (HICP euro area); ECB (deposit facility rate); ECB long-term interest rate statistics (10-year OAT); Notaires de France; Banque de France; Observatoire Crédit Logement/CSA. Descriptive analysis, not investment advice.
Last updated — 25 July 2026
Disclaimer – Financial Information: The analyses, commentary, and content published on eco3min.fr are provided for informational and educational purposes only. They do not constitute investment advice or a solicitation to buy or sell financial instruments. Past performance is not indicative of future results. All investment decisions involve risk and are the sole responsibility of the reader.
Read next
Full pillar →US Rental Property Real Yield: What Cap Rate and NOI Actually Leave You
A rental listing leads with a yield. Divide the annual rent by the price and the number looks…
Cap Rate Spread: What Rental Yield Pays Over the 10-Year Treasury
A 5% cap rate sounds attractive. But 5% against what? A risk-free 10-year Treasury yields near 4.5% in…
Vacancy and Turnover: The Cost That Erodes a Landlord’s Real Return
A listing shows full rent, twelve months a year. The owner knows the gaps between tenants, the make-ready…