Russell 2000: The Hidden Message Behind Underperformance
The Russell 2000 sends a key signal on the business cycle, US equity risk and the allocation between large and small caps. Its current lag reflects the cost-of-capital shock on US domestic balance sheets more than a temporary discount.

The Russell 2000 sends a key signal on the business cycle, US equity risk and the allocation between large and small caps.
TL;DR
Russell 2000 firms that borrowed at 1 to 2% in 2020-2021 now refinance at 7 to 8% high-yield rates through 2027, a margin squeeze its recent rebound has not cleared.
- Since 2022, fed funds rose from 0–0.25% to roughly 5.25–5.5%, shifting the index's sensitivity from growth expectations toward credit spreads, refinancing access and debt costs.
- A 3 to 4-point rise in average debt cost can consume most of the operating margin of a firm running near 10%, an effect the index aggregates across many stretched balance sheets.
- The index has historically outperformed on recession exits with sharp rate cuts (2003–2004, 2009–2010) but lagged through tightening and credit stress (2018, 2000–2002, 2008).
- A sustained rise in the Russell 2000 / S&P 500 ratio alongside high-yield spreads narrowing toward roughly 3 points has historically marked genuine risk repricing for smaller companies.
Russell 2000: Why the «Small» Index Carries Outsized Weight for the Cycle
Since early October 2025, the Russell 2000 has rebounded by roughly ≈11%, but remains far behind the S&P 500, which gained ≈23% over the same trailing 12-month period (figures as of late November 2025, aggregated market data). This persistent gap between small and large caps is more than a style-investing issue: it tells something specific about macro risk, the cost of capital and the depth of the US cycle. This theme is examined in our study on the gap between equity markets and the real economy.
To place this signal within a broader frame, readers seeking the general architecture of markets can revisit the reference framework on how financial markets operate, then use the Russell 2000 as a finer thermometer of risk-taking.
What is shifting quietly is the way the Russell 2000 is moving from being a simple «small caps» barometer to becoming a leading indicator of how elevated rates transmit to the balance sheets of US domestic corporates.
Trigger Event: A Rebound That Does Not Yet Validate the Risk
The recent trigger: in early December 2025, the Russell 2000 briefly cleared a key technical zone around 2,050 points, a level first tested in 2021. Despite this move, the index remains roughly ≈18% below its all-time highs, while the Nasdaq 100 had narrowed the gap to its own record to less than 5% on the same date.
Part of the consensus expects this small-cap lag to close mechanically through the monetary easing anticipated for 2026, drawing on the historical pattern of small-cap outperformance early in easing cycles. The analysis that follows rests on a different hypothesis: this time, the Russell 2000 is reacting more to balance sheet structure (short-term debt, refinancing) than to growth expectations alone, which changes the potential speed of any catch-up.
This gradual but real shift in the index’s sensitivity — from revenue prospects toward the cost of capital — is a signal still drowned out by the noise of tech index records.
What the Russell 2000 Actually Measures
The Russell 2000 covers ≈2,000 US small and mid caps, heavily oriented toward the domestic economy and often with limited international exposure. Macroeconomically, the index concentrates:
- companies more dependent on bank credit and high yield financing,
- weaker pricing power than S&P 500 megacaps,
- margins that tend to be more volatile, particularly during inflation and tight wage conditions.
Between 2010 and 2019, with US policy rates near zero, the correlation between the Russell 2000 and the S&P 500 was strong, the small-cap risk premium being primarily tied to future growth. Since 2022, with fed funds moving from 0–0.25% to ≈5.25–5.5% (US monetary policy framework), the Russell 2000 has become significantly more sensitive to financial conditions: credit spreads, refinancing access, debt costs.
This suggests that reading the cycle today through tech megacaps or the S&P 500 alone amounts to ignoring where monetary policy bites hardest: the strained balance sheets of smaller companies.
Mechanisms: How Rates and the Dollar Pressure Small Caps
Three channels dominate the Russell 2000’s behavior:
1. Cost of Capital and Refinancing Wall
A meaningful share of Russell 2000 constituents issued debt when US rates were near 1–2% during 2020–2021. Between 2025 and 2027, a refinancing wave will hit at high yield bond yields around 7–8% (order of magnitude in the US market in late 2025). Moving from 2% to 7% financing cost across hundreds of billions of cumulative debt represents a silent margin shock. French smaller firms went through a comparable repricing on bank debt rather than bonds: the rate on new French corporate loans up to EUR 1m moved from 0.62% in 2020 to 4.45% in 2024.
Concretely, for a business running a 10% operating margin, a 3 to 4-point increase in average debt cost is enough to consume much of that margin. The Russell 2000 amplifies this effect because it aggregates many companies with stretched balance sheets.
2. Inflation and Pricing Power
US inflation fell from over 8% in mid-2022 to ≈2.5–3% in the second half of 2025 (broad consumer price aggregates). Megacaps protected their margins through market power and productivity gains, often via AI and automation. Smaller companies have struggled more:
- they absorb wage increases,
- they have less pricing leverage with customers,
- they often lack the means to invest in AI to offset cost pressure.
Where megacaps benefit from the productivity shock, many Russell 2000 companies still face margin compression.
3. Financial Conditions and Risk Appetite
On the flow side, ETFs and large-cap funds capture the bulk of capital: in 2025, net annual flows into US equity ETFs exceeded ≈$500bn, with more than 70% absorbed by broad-index products (order of magnitude on flow aggregates). Small caps remain often a tactical allocation, easy to trim when macro visibility is poor.
The central scenario held by many participants assumes that the simple decline in policy rates will redirect flows back to small caps. The logic here differs: if growth stays soft and credit defaults rise, investors may continue to favor large quality names even longer, even within a somewhat lower rate environment.
What Readers Really Want to Know
What many seek to understand is whether the Russell 2000’s lag represents a catch-up opportunity or an early sign of more serious macro risk. The real question is less about whether the index rises or falls in the short term, and more about whether the risk-return profile of small caps has historically supported increased exposure now or after a clearer easing of financial conditions.
Historical Reading: When the Russell 2000 Outperforms, and When It Warns
Historically, the Russell 2000 has outperformed the S&P 500 in two types of phases:
- recession exits with sharp rate cuts (e.g., 2003–2004, 2009–2010),
- periods of domestic euphoria and abundant credit (roughly 2013–2015).
Conversely, it has clearly underperformed:
- during rapid monetary tightening (1994–1995, 2018, 2022–2023),
- during episodes of credit stress or confirmed recession (2000–2002, 2008).
If the current cycle resembles a «long plateau of positive real rates» rather than a swift return to free money — a backdrop credited by many macro projections for 2026 — then the Russell 2000 may stay behind longer than expected, except for momentary spikes tied to short squeezes or sector rotation.
Common Reading Error: Confusing «Discount» With «Margin of Safety»
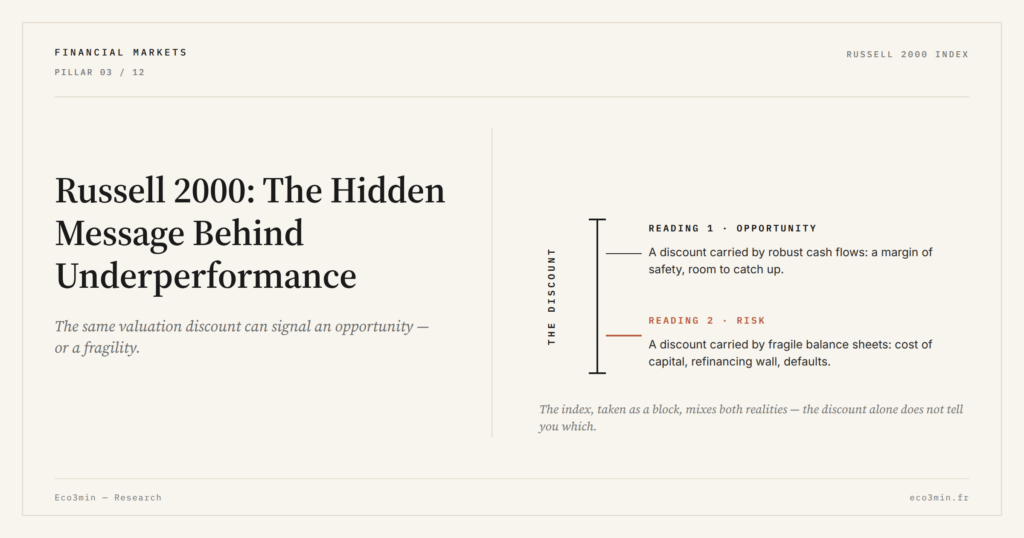
A recurring error treats the Russell 2000’s underperformance as a simple «mechanical discount» primed for a rapid catch-up, on the basis that the performance gap with large caps is historically wide. This reading is misleading if it ignores balance sheet quality and the rate structure: a discount can equally reflect dilution risk, massive refinancing or rising defaults.
The more rigorous approach distinguishes: valuation discount on robust cash flows (opportunity) vs discount tied to balance sheet fragility (risk). The Russell 2000, taken as a block, mixes both realities.
Three Possible Trajectories for the Russell 2000
1. «Orderly Catch-Up» Scenario (Moderate Probability)
This scenario assumes US growth holds around 1.5–2% in 2026, inflation stays under control, and the central bank cuts rates toward 3–3.5% over 18 to 24 months. In this frame, credit defaults remain contained, the refinancing wall is manageable, and investors gradually rebalance toward small caps within US equity exposure.
Likely outcome: a Russell 2000 outperformance of a few points per year versus the S&P 500, but without an explosive rally. This is the central scenario embedded in many allocation frameworks.
2. «Brutal Selectivity» Scenario (Underestimated Risk)
Here, growth slows more than expected, margins compress and credit spreads widen. Rates do fall, but not fast enough to offset the refinancing shock. Investors become highly selective: they favor a few quality leaders within the Russell 2000 and leave the rest of the index aside.
In this configuration, the overall index can stay flat or decline, while individual names outperform sharply. For an index investor, the risk is to underperform the broader US market for several years despite a contrarian small-cap stance.
3. «Credit Shock» Scenario (Low Probability, Large Impact)
A less probable but high-impact scenario: marked stress on US corporate credit (rapid rise in defaults, banking tightening, regulatory shock). Such an episode could trigger a disproportionate decline in the Russell 2000, given the balance sheet sensitivity of its constituents.
The market does not fully price this possibility: high yield spreads have eased slightly since mid-2024, and implied volatility on Russell 2000 options does not reflect a hard-landing scenario. Yet, were this situation to materialize, the index would become one of the principal channels of market-finance-real economy transmission.
What Could Invalidate This Reading
Several factors could render these scenarios obsolete:
- a far more aggressive rate-cutting cycle than expected, which would revive risky credit and offer massive relief to small-cap balance sheets;
- a positive productivity shock reaching smaller companies (for instance, much faster than expected diffusion of turnkey, low-cost AI solutions);
- a targeted fiscal boom for SMEs, directly altering their revenue trajectory and default risk.
Conversely, an unexpected monetary tightening (inflation returning above 4%) or a global negative demand shock would weaken small caps further, and therefore the Russell 2000.
Concrete Implications for Allocation
1. Observational Framework for US Equity Allocation
Across diversified portfolios, allocations have historically been observed in patterns such as roughly 60% large-cap US (or global) equities, 25% non-US equities or specific exposures (Europe, emerging markets, themes), and 15% Russell 2000 or small/mid-cap exposure via ETFs or single-name selection.
Across risk profiles, the Russell 2000 sleeve has historically ranged from approximately 5% in more conservative configurations to 20% in more aggressive ones. The relevant question is less about chasing a catch-up than calibrating position size in line with the elevated volatility profile observed in this segment.
2. Entry and Exit Signals to Monitor
For tactical observation, three practical signals:
- US high yield spreads: a sustained narrowing of the high yield to 10-year Treasury spread toward ≈3 points has historically signaled more accommodative financial conditions for smaller companies.
- Russell 2000 / S&P 500 ratio: a clear reversal of this ratio over several weeks, accompanied by rising volumes on small-cap ETFs, has historically reinforced catch-up phases.
- Credit default forecasts: when projected default rates on speculative-grade credit stabilize below 3–4% annualized, extreme risk has historically receded.
3. Risk Reading for Companies and Households
For companies exposed mainly to the US domestic market, the Russell 2000 can serve as an early warning on the ability of customers or suppliers to absorb price increases or refinance debt. A persistently struggling index suggests an environment where balance sheet caution and liquidity remain priorities.
For households, periods marked by elevated small-cap volatility have historically been associated with measured exposure rather than concentrated bets. Investors who built exposure progressively through regular contributions, while keeping the bulk of long-term savings on broad indices or diversified equity and ETF approaches, observed lower drawdown sensitivity than those concentrating allocations into a single segment.
Key Indicator to Track: The Russell 2000 / S&P 500 Ratio
The principal KPI for monitoring this topic is the Russell 2000 / S&P 500 performance ratio. It is calculated by dividing the level (or the value of a representative ETF) of the Russell 2000 by that of the S&P 500. A sustained upward trend in this ratio, combined with narrowing credit spreads, has historically indicated that the market is genuinely repricing risk for smaller companies.
If this dynamic persists, it can be read as a regime change in favor of small caps. As long as the ratio trends down or remains flat, the message stays clear: markets reward balance sheet quality and size more than the sole hope of domestic growth. Reading a ratio as a message already assumes the anticipation mechanism by which equity markets run ahead of the economic cycle.
Reader questions
- Is replacing an S&P 500 ETF with a Russell 2000 ETF a documented strategy?
Not necessarily. A more measured approach observed across diversified portfolios involves complementing S&P 500 exposure with a smaller Russell 2000 sleeve. Full replacement shifts the portfolio to a higher risk profile without any historical guarantee of outperformance. - When is it too late to enter the Russell 2000 if the catch-up begins?
The principal historical risk is not missing the first percentage points of upside, but entering as credit conditions tighten again. Tracking high yield spreads and the Russell 2000 / S&P 500 ratio over several weeks has historically provided a more reliable signal than attempting to identify the exact bottom. - Are US small caps still relevant if global growth slows?
Empirically, they remain a domestic US diversification driver more than a global growth play. In sharp slowdowns, observed allocations have tended to be reduced rather than eliminated entirely. - Is selecting individual Russell 2000 names preferable to the full index?
For investors able to analyze balance sheets, single-name selection has historically reduced default risk and targeted higher-quality companies. For most retail participants, a broadly diversified ETF has historically simplified execution and limited individual selection error.
Conclusion: Reading the Russell 2000 as a Warning Light, Not a Bet
The Russell 2000 today reads less as an automatic «catch-up ticket» than as a warning light on the balance sheet fragility of part of the US productive fabric. The dominant scenario is not a major crisis but a slow normalization in which selection and fine risk management matter more than blunt small-cap exposure.
For investors, the framework involves using this index as a leading indicator of monetary policy transmission to the most exposed companies, rather than as a promise of superior returns. The risk is less visible than others — hence easier to ignore — but it deserves an explicit place in portfolio construction and in reading the coming business cycle.
- 3 takeaways
- The Russell 2000’s lag mainly reflects the cost-of-capital shock on US small caps, not just a temporary «discount.»
- A simple rate easing does not guarantee a massive catch-up: balance sheet quality and credit conditions will be decisive.
- Russell 2000 allocations of 5–20% within US equity exposure have historically captured potential catch-up moves while keeping credit-shock risk bounded.
Last updated — 18 September 2026
Disclaimer – Financial Information: The analyses, commentary, and content published on eco3min.fr are provided for informational and educational purposes only. They do not constitute investment advice or a solicitation to buy or sell financial instruments. Past performance is not indicative of future results. All investment decisions involve risk and are the sole responsibility of the reader.
Read next
Full pillar →Reading Earnings Surprises: Cash Flow, Margins, Guidance
How to analyze an earnings surprise beyond the simple beat or miss: cash flow, margins, guidance, and weak…
Equal-Weight ETFs: The Quiet Signal Behind Rising Indices
Equal-weight ETFs reveal the true health of the equity market behind mega-cap-driven indices. Their gap with cap-weighted ETFs…
Smart Beta ETFs: The Hidden Risk Behind Factor Performance
Smart beta ETFs now hold ~15-20% of global equity ETF assets. Stacking factor exposures often rebuilds hidden concentration…