Loan Term Mechanics: How 15-Year vs 30-Year Reshapes the Monthly Payment

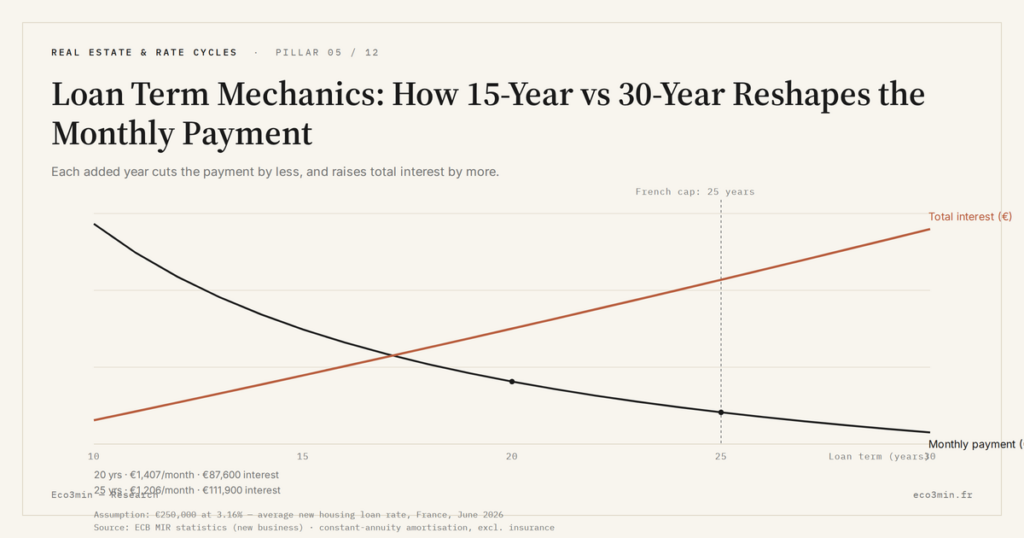
Stretching a mortgage’s term lowers the monthly payment, so a given income can carry a larger loan. The move looks like a win. It is one today, and a cost across the years.
The term is the most visible lever on capacity and the most misread. It creates no budget; it moves part of the present into a future cost.
A longer term lowers the payment and raises the loan a given income supports, but multiplies total interest, the 15-year and 30-year framings sitting at opposite ends of that trade.
- The term’s effect on the payment is non-linear: the first years added lower it more than the last.
- The 15-year survey rate sat at 5.82% against 6.49% on the 30-year in July 2026, a spread near two-thirds of a point.
- The 30-year maximizes borrowing capacity; the 15-year minimizes lifetime interest.
Term and payment, the non-linear curve
A longer term lowers the payment, but not in proportion. On a fully amortizing loan, each year added reduces the payment by less than the year before. Moving from ten to fifteen years cuts the monthly figure sharply; moving from twenty-five to thirty trims it only modestly. The curve flattens because, as the term lengthens, a growing share of each payment covers interest rather than principal.
A figure makes it concrete. A $350,000 loan at the July 2026 survey rate of 6.49% on a 30-year term carries a principal-and-interest payment near $2,210. The same loan on a 15-year term, at that term’s lower 5.82% rate, runs closer to $2,910 a month, higher despite the lower rate, because the balance must clear in half the time. The longer term lowers the payment and, with it, raises the loan a given income can support. That is where the reversal begins, the belief that the longer loan is the cheaper deal. A longer term buys capacity today and a larger bill tomorrow.
The diminishing effect has a cause worth naming. In the early years of a long loan, the payment covers mostly interest, charged on a balance still nearly intact; principal repayment accelerates only later. Adding years to the term therefore adds years dominated by interest, which is why the gain on the payment fades: each extra year lowers the installment by less while lengthening the stretch during which the borrower mostly pays interest. The term works hard at the start of the curve and weakly at the end, an asymmetry that shapes the entire trade.
A graded example makes it visible. On a fixed loan, cutting the term from thirty to twenty-five years raises the payment noticeably; from twenty-five to twenty raises it more; from twenty to fifteen more still. The slope runs the same way in both directions: the shortest years are the expensive ones in monthly terms and the richest in interest saved. A borrower who stretches the term captures the monthly relief where it is cheapest to buy, but pays interest where it piles up fastest, which is precisely why the headline payment flatters the longer loan.
15 versus 30: the rate spread
The two canonical terms do not share a rate. Lenders price the 15-year below the 30-year, a spread that stood near two-thirds of a point in July 2026, at 5.82% against 6.49%. The shorter term carries less duration risk for the lender, and that discount compounds with the faster amortization to widen the gap in total interest between the two paths.
The reason the 15-year prices lower is structural. A shorter loan returns the lender’s capital faster and spends less time exposed to interest-rate and prepayment risk, so investors accept a lower yield to hold it. That pricing edge is not a promotion; it reflects the lower risk of a loan that self-liquidates in half the time. The spread widens or narrows with the rate environment, but the 15-year almost always sits below the 30-year, adding a rate advantage on top of the faster payoff. The two effects push the same way on lifetime cost, and against the monthly payment. The upshot is that the rate spread and the payoff speed reinforce each other on the 15-year side, so the shorter term’s total-cost advantage is larger than its rate advantage alone would suggest.
The spread cuts against the payment difference. A borrower drawn to the 15-year for its lower rate still faces a higher monthly payment, because the shorter schedule dominates the rate saving. Conversely, the 30-year borrower pays a higher rate and a lower payment, financing the same principal more slowly. The rate spread is real, but it is second-order next to the term’s effect on how fast the balance falls, a distinction that how debt-to-income bounds the payment frames from the qualification side.
Total interest across the term
The lifetime cost is where the two terms diverge most. Because the 30-year loan amortizes slowly and carries a higher rate, its total interest can run well beyond that of the 15-year, often by a large multiple over the life of the loan. The lower monthly payment is not a discount; it is the same or greater cost, spread thinner and stretched longer.
The gap is large in dollars. On the $350,000 loan above, the 30-year path at 6.49% pays several hundred thousand dollars in interest over its life, while the 15-year at 5.82% pays a fraction of that, despite the higher monthly payment, because the balance clears in half the time and at a lower rate. The 30-year borrower finances roughly the same house for a far higher total outlay, in exchange for a lighter payment and more capacity along the way. Neither number is hidden, but only one appears on the monthly statement, which is why the lifetime figure so often goes unweighed.
The term is not permanent either. A borrower who takes the 30-year can refinance into a shorter term when rates fall, recapturing part of the interest the longer schedule would have cost, subject to closing costs and a break-even period. Refinancing into a longer term, by contrast, resets the clock and can raise lifetime interest even at a lower rate, because the balance amortizes from the start again. The option to shorten later is one more reason the choice is a trade to be weighed, not a discount to be taken.
This is the affordability illusion in its clearest form. A buyer comparing terms by the monthly payment alone concludes the longer one is easier, which it is month to month, and cheaper, which it is not. The rate itself sets how steep the penalty is: the higher the rate, the more a longer term costs, a link traced across the history of real interest rates and the long arc of the long history of mortgage rates.
What buying capacity costs
The trade can be stated plainly. The 30-year term raises the loan a given income supports, opening access to a costlier home or a wider margin, while the 15-year term minimizes the interest paid over the life of the loan. Each buys something the other gives up: present capacity against lifetime cost. The term manufactures no wealth; it exchanges budget now for interest later, on terms the rate makes more or less favorable.
The rate environment tilts that exchange. When rates are low, stretching the term adds little interest, and the capacity gain often dominates; when rates are high, as they have been since 2023, the same extra years pile on far more interest, making the transfer into the future costlier. The term is not a neutral setting: its real value depends on the rate it applies to, so a trade that made sense in 2021 need not make sense in 2026. It is the rate context, as much as the term itself, that decides what buying capacity actually costs, which is why the same term can be a reasonable trade in one rate regime and a costly one in another.
This is an observation, not a prescription: no single term is universally better. A borrower who prioritizes reach today and one who prioritizes total cost will choose differently, and neither is wrong given their aims.
One US-specific feature reshapes the trade: conventional mortgages generally carry no prepayment penalty. A borrower can take the 30-year for its lower required payment and its larger capacity, then make extra principal payments to mimic a shorter term when cash allows, keeping the flexibility to fall back to the lower payment in a tight month. The 15-year locks in discipline and a lower rate but removes that optionality. This turns the choice into one about flexibility as much as cost, since the 30-year with voluntary prepayments can approach the 15-year’s payoff without committing to its higher required payment.
Equity shifts this trade too, as how equity moves the rate shows, and income sets the ceiling the term works within, described in how the rate sets the borrowing ceiling.
Assuming the longer loan is the cheaper deal. That confuses payment with cost: the longer term lightens each installment but raises the total paid. It does not lower the price of credit; it stretches and enlarges it, moving budget from today into interest tomorrow.
A shift in time, not a discount
The term is an instrument of temporal transfer, not reduction. It moves capacity toward the present and cost toward the future, under a framework that bounds the exercise. Read as a trade rather than a discount, it stops the monthly payment from standing in for the whole picture, and it reframes the choice around what each borrower values: reach now, cost later, or the flexibility to move between them. That reading places the term among the levers whose effect runs through the mortgage purchasing-power sub-pillar.
Last updated — 3 August 2026
Disclaimer – Financial Information: The analyses, commentary, and content published on eco3min.fr are provided for informational and educational purposes only. They do not constitute investment advice or a solicitation to buy or sell financial instruments. Past performance is not indicative of future results. All investment decisions involve risk and are the sole responsibility of the reader.
Read next
Full pillar →US Rental Property Real Yield: What Cap Rate and NOI Actually Leave You
A rental listing leads with a yield. Divide the annual rent by the price and the number looks…
Cap Rate Spread: What Rental Yield Pays Over the 10-Year Treasury
A 5% cap rate sounds attractive. But 5% against what? A risk-free 10-year Treasury yields near 4.5% in…
US Rental NOI, Line by Line: What Net Operating Income Really Subtracts
A US rental yield is advertised gross: annual rent over price. Between that number and the income an…