ARR: Why This Metric Sometimes Overstates Tech Value
ARR: a key metric for SaaS companies, but one that can mask churn, discounts and rate sensitivity in tech valuations.

ARR: a key metric for SaaS companies, but one that can mask churn, discounts and rate sensitivity in tech valuations.
TL;DR
With US policy rates lifted toward 4-5% since 2022, a euro of ARR discounted at a higher cost of capital is worth less today than in the prior zero-rate era.
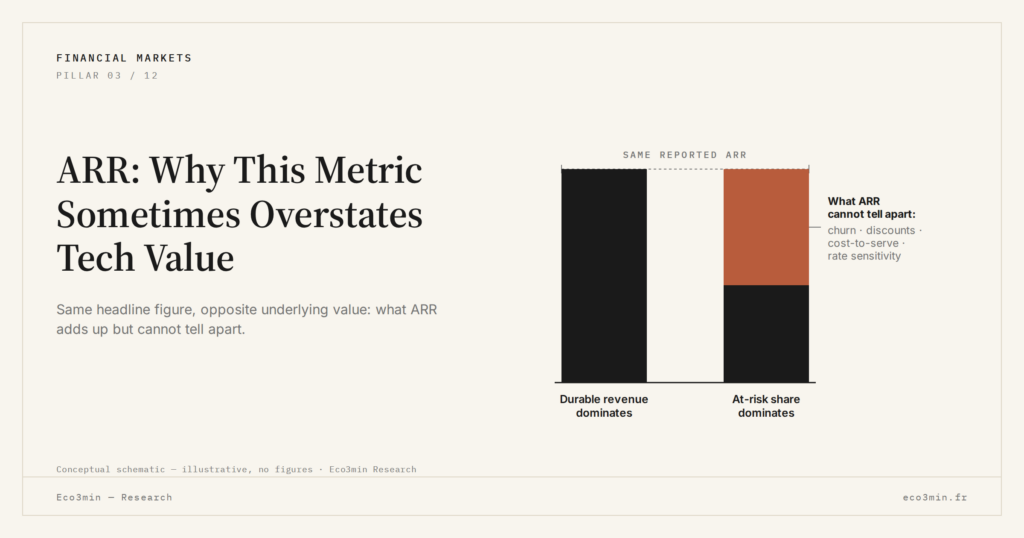
- ARR is a volume metric, not a profitability one: €100m of ARR can mean an already-profitable model above 20% operating margin or a company burning €20-30m a year to hold that base.
- Between 2022 and 2025 many SaaS players sustained ARR through aggressive discounts and lower-margin renewals, so the headline figure can rise while net churn and future profitability erode.
- Net revenue retention reads the figure better than ARR alone: NRR durably above 110% points to an organically expanding base, while drift toward 100% signals saturation.
- ARR is less defensive than it looks: in a slowdown, IT departments cut seats, drop options and renegotiate contracts, lengthening sales cycles, so the same ARR level grows more fragile when the cycle turns.
ARR: the number everyone watches… and what it leaves out
In listed tech, one metric dominates investor presentations: ARR (annual recurring revenue). In just a few years, it has become the implicit anchor for many valuations, particularly in SaaS models. What prices imperfectly reflect today is that this aggregate was built to describe activity, not to capture, on its own, the economic value of a company.
Since the summer of 2025, several software groups have reported still-solid ARR growth (≈+15% to +25% over 12 months) while announcing pressured margins and more volatile cash flows. This gap between the reported ARR dynamic and the financial reality sharpens the central question: does ARR work as a false safe haven for tech valuations?
Angle paragraph: what matters more than the headline ARR figure
What quietly changes the usual reading is not so much the absolute level of ARR, but the quality of that figure: client mix, discounts, churn, costs to maintain the installed base, rate sensitivity. As long as the market remained focused on a single growth metric, these nuances stayed in the background; in an environment of higher rates and more selective capital, they become decisive again for interpreting the value behind ARR.
Research intent: understanding the limits of ARR for valuation
The intent of this article is strictly informational: clarifying how ARR is built, why it has gained such prominence in tech, and how it can create an illusion of safety when used as a near-synonym for value. The goal is not to judge whether a company is “expensive” or “cheap”, but to decode a mechanism that many perceive as a reliable shortcut.
ARR: definition, implicit promise and link to monetary policy
ARR corresponds, in simplified terms, to the volume of recurring revenue committed on an annual basis: SaaS subscriptions, multi-year contracts billed on a recurring basis, software maintenance. A company billing €10m of annual “recurring” subscriptions will typically report €10m of ARR.
The appeal of this metric is clear:
- it provides visibility on a portion of revenue expected in the short term;
- it tracks growth in the installed base (new customers, expansion of existing contracts);
- it serves as the basis for many market multiples (EV / ARR, sometimes presented as a substitute for EV / sales).
During the 2020–2021 cycle, with policy rates close to 0% in advanced economies, many valuation models implicitly extrapolated ARR as a quasi-perpetual flow, discounted at a very low cost of capital. The general framework of monetary policy, detailed in the analysis of real policy rates, played a central role: the closer real rates were to zero or in negative territory, the more tempting it became to treat each euro of ARR as an asset of high present value.
Since 2022, the rate hikes by major central banks (nominal policy rates lifted toward ≈4% to 5% in the United States and ≈3% to 4% in the eurozone between 2022 and 2024) have raised the cost of capital and shifted the debate: a given level of ARR no longer carries the same present value as five years ago, especially when the company is still consuming cash.
Why the market consensus is so drawn to ARR
A large share of the consensus views ARR as an “objective” anchor for valuing SaaS companies:
- it is easy to compare across companies, regardless of local accounting standards;
- it is less manipulable than some adjusted metrics (adjusted EBITDA, “non-GAAP” margins, etc.);
- it fits the narrative of “recurrence” and revenue “visibility”.
Mainstream projections often assume a scenario in which:
- ARR growth remains above 15% per year for players considered “high quality”;
- churn stays contained (often ≈5% to 10% of the customer base per year);
- monetization of AI or premium features sustains pricing power.
The reading offered here diverges on one key point: even if these assumptions are met, ARR says almost nothing, on its own, about the capital required to achieve them (sales costs, R&D, server expenses, customer support), nor about the resilience of these flows in the event of a macro shock or a prolonged rise in real rates.
This analysis falls within the field of financial innovation applied to listed technology companies and SaaS models. It does not address crypto-assets, tokens or valuation mechanisms specific to blockchain markets.
The structural fragilities of ARR as a “safe haven”
1. A volume metric, not a profitability metric
An ARR of €100m can correspond to two opposite economic realities:
- an already profitable model, with operating margin above 20%, generating cash;
- a company still burning ≈€20m to €30m per year to maintain that base (high customer acquisition costs, resource-heavy support, expensive infrastructure).
Current valuation projections often embed the idea that scale effects will eventually turn this ARR into comfortable margins. This scenario assumes that growth in the installed base will gradually absorb fixed costs. The rise in the cost of capital since 2022 makes this bet more demanding: a euro of cash burned today “weighs” more in valuation models than during the zero-rate era. This discount-factor mechanism is one of the channels discussed in our analysis of the sometimes counterintuitive effects of higher rates on markets.
2. Churn, discounts and the quality of recurring revenue
Between 2022 and 2025, many SaaS players sustained ARR growth through aggressive discounts and contract extensions at lower margins. The ARR figure can therefore rise while future profitability deteriorates.
A theoretical example illustrates the point: if a customer was paying €100k per year and renews for 3 years at €80k with additional options, reported ARR remains elevated, but future profitability can compress. Net churn (additions – departures – contract downgrades) becomes more important than headline ARR.
3. Hidden sensitivity to macro cycles and rates
On paper, ARR conveys an image of stability superior to that of transactional revenue. In practice, it is less defensive than it appears:
- during a slowdown, IT and finance departments renegotiate contracts, cut seats, drop little-used options;
- sales cycles lengthen, weighing on future ARR growth;
- pressure on IT budgets can trigger a wave of rationalization (consolidation around fewer tools).
A more strained macro framework — as described in the weekly macroeconomic barometer — changes how client companies arbitrate between software solutions. In other words: the same level of ARR can become more fragile if the economic cycle turns.
What readers really seek behind the question “is ARR a safe haven?”
What many are trying to understand is not only whether ARR will keep growing, but whether that growth still suffices to offset durably higher rates and margin pressure. The real question is less whether a vendor’s ARR rises or falls by a few points than whether the quality of that recurring revenue is sufficient to justify a valuation that often still rests on elevated multiples.
Macro + micro reading: how ARR interacts with the cost of capital
The link between monetary policy and tech valuations runs through a relatively simple chain:
- central banks raise policy rates to contain inflation (in the United States, inflation moved from around 7% to 8% in 2022 to ≈3% to 3.5% in 2024–2025 according to aggregated macro data);
- real interest rates (nominal rates – inflation) rise, lifting investor return requirements;
- growth companies financed by markets must justify cash burned today by more credible future flows.
In this context, ARR still growing 20% per year is no longer interpreted as it was in 2020. Mainstream scenarios often assume that AI-driven productivity will offset part of the rise in funding costs. But this assumption remains fragile: deploying AI features generates new costs of its own (GPU infrastructure, model licensing, specialized teams) that are not always reflected in the simple ARR curve.
For a more global reading of interactions between financial markets, rates and risk premiums, the financial innovation category page provides a useful framework for situating ARR among other metrics.
Common reading errors on ARR
- Confusing ARR with guaranteed cash flow. ARR reflects a contractual commitment at a given moment, not a certain future monetary flow. Termination, renegotiation, contract downsizing remain possible, particularly in an uncertain macro environment.
- Overinterpreting an isolated EV / ARR multiple. A multiple of 8x or 10x may seem reasonable in sector comparisons, but without examining margin, churn and investment needs, it says little about the sustainability of the valuation.
- Ignoring the cost structure required to maintain ARR. Some recurring bases require intensive support, specific integrations, ongoing marketing costs. A high but “expensive-to-keep” ARR is less robust than a modest ARR with a very sticky base.
Finer indicators to track around ARR
A single KPI is not enough. To better understand the dynamic behind ARR, several complementary indicators play a key role:
- Net revenue retention (NRR): measures ARR growth on an existing customer base (expansions – churn). NRR durably above 110% suggests an organically expanding base; NRR drifting toward 100% signals saturation.
- Logo churn vs ARR churn: distinguishing the number of customers lost (logo churn) from the value of revenue lost (ARR churn). Losing few but very large customers is more problematic than the reverse.
- CAC / LTV ratio (acquisition cost vs lifetime value): if acquisition cost rises as ARR grows, growth can become less and less value-creating.
- Free cash-flow margin: even approximate, the free cash margin gives a concrete signal of the company’s ability to fund its growth.
For ongoing tracking, some observers build dashboards crossing ARR growth, NRR and cash margin over 3 to 5 years, rather than focusing on a single quarter.
Possible scenarios around ARR as a dominant metric
Scenario 1: gradual normalization (central consensus)
In this scenario, most SaaS players manage to:
- stabilize ARR growth between 10% and 20% per year;
- gradually improve operating margins through AI and cost optimization;
- reduce reliance on external financing.
ARR would remain the headline metric, but embedded in a broader grid including margins and cash flows. It is not the most spectacular scenario, but it is the one many bank models use as a baseline.
Scenario 2: abrupt repricing of ARR multiples
A second scenario, less visible in the consensus, would be a rapid recompression of multiples applied to ARR if:
- policy rates remained durably higher than expected;
- a marked macro slowdown drove churn higher and forced downward renegotiations;
- AI monetization promises were slow to translate into margins.
In that case, ARR would lose its quasi-safe-haven status: the metric would still grow, but the value attributed per unit of ARR could decline sharply. The risk is less visible than a fall in headline revenue, and therefore easier to ignore in confident market phases.
Scenario 3: shift toward customer-value indicators
A third, more structural scenario would be a gradual migration toward indicators centered on the unit economics of customers: margin by segment, lifetime value net of service costs, sectoral exposure to the economic cycle, and so on. ARR would still be present, but as a starting point rather than an end metric. This scenario assumes greater maturity among tech investors and better integration of macro constraints (rates, inflation, cycles) into models.
This is not the central scenario today, but it gains plausibility as the rate environment moves further from the 2010–2020 regime. The market does not fully price this possibility, partly because ARR is a simple, immediately communicable figure, while more complete metrics are harder to summarize.
Concrete implications for different actors
For investors: the key question is not whether ARR is “good” or “bad”, but what lies behind it: churn profile, cost to maintain the base, sensitivity to cycles. A simple metric can obscure complex trade-offs between growth and profitability.
For technology companies: relying on ARR as a central metric remains useful for steering growth, but credibility with markets increasingly depends on the ability to articulate it alongside cash and profitability indicators, especially in a higher-rate regime.
For non-financial decision-makers (executives, managers, stock-optioned employees): understanding the limits of ARR helps better interpret the company’s valuation, financing cycles and cost decisions. Behind a rising ARR, the value-creation trajectory can be more uncertain than it appears.
In summary, ARR is not a bad metric: it is an incomplete one. As long as it remains presented and perceived as a near-automatic “safe haven” for tech valuations, the risk is to underestimate the combination of macro factors (rates, inflation, cycle) and micro factors (churn, discounts, costs) that can, over time, profoundly alter how it should be read.
Frequently asked questions about ARR and tech valuations
How does ARR differ from MRR for assessing a SaaS company?
ARR annualizes recurring revenue, MRR measures it monthly. For valuations, ARR offers a more readable annual snapshot, but it can smooth intra-year variations (seasonality, promotions, one-off churn) that MRR makes more visible.
Is strong ARR growth enough to offset operating losses?
Not necessarily. Much depends on the time required to reach profitability and on the cost of capital. If real rates remain elevated and financing needs are large, strong ARR growth may not be enough to make the model durably value-creating.
Why do some players communicate more on NRR than on total ARR?
NRR emphasizes the ability to expand the existing base, which is often perceived as more profitable than acquiring new customers. In already well-penetrated markets, NRR sometimes provides a better view of monetization potential than headline ARR.
How do rate hikes concretely influence ARR multiples?
Higher policy rates raise the discount rate used to value future flows. Even if ARR grows, the present value of those flows can decline if the cost of capital rises. This is particularly sensitive for companies generating little or no cash today. Between the discount rate and the multiple runs the broader mechanics of equity valuation through real rates, multiples and earnings, of which ARR is only one instance.
Can AI make ARR more “solid” by improving margins?
AI can reduce certain costs (support, prospecting, automation) and therefore improve the margins associated with a given ARR. But it also creates new expense lines and does not guarantee that customers will accept price increases. Its net impact will depend on the balance between productivity gains and additional costs.
3 takeaways
- ARR describes the size of a recurring revenue stream, not its robustness or its cost: used in isolation, it can produce an illusion of safety.
- In a higher-rate world, the value of one euro of ARR depends far more than before on churn, discounts and cash margins.
- The real challenge is not to abandon ARR, but to place it within a broader framework that integrates the macro cycle, the cost of capital and customer quality.
Last updated — 18 September 2026
Disclaimer – Financial Information: The analyses, commentary, and content published on eco3min.fr are provided for informational and educational purposes only. They do not constitute investment advice or a solicitation to buy or sell financial instruments. Past performance is not indicative of future results. All investment decisions involve risk and are the sole responsibility of the reader.
Read next
Full pillar →Reading Earnings Surprises: Cash Flow, Margins, Guidance
How to analyze an earnings surprise beyond the simple beat or miss: cash flow, margins, guidance, and weak…
Equal-Weight ETFs: The Quiet Signal Behind Rising Indices
Equal-weight ETFs reveal the true health of the equity market behind mega-cap-driven indices. Their gap with cap-weighted ETFs…
Smart Beta ETFs: The Hidden Risk Behind Factor Performance
Smart beta ETFs now hold ~15-20% of global equity ETF assets. Stacking factor exposures often rebuilds hidden concentration…