
Brent Crude Pullback: Easing or Pause Before Tension?
Brent crude: how to interpret the late-2025 price retreat and recalibrate exposure across geopolitical risk, inventories, demand and the rate cycle.

The Brent crude pullback in late 2025 unfolds against a deceptive backdrop: prices easing on the surface, while supply constraints and geopolitical risks remain in the background.
TL;DR
Brent's near-15% slide to the low-$80s by mid-December 2025 coexists with thin OPEC+ spare capacity of 3 to 4 million barrels a day against record demand near 103 million. A complementary angle: the Eco3min framework on commodities as macroeconomic regime signals.
- The futures curve flattened as the front-month to late-2026 spread narrowed from about $6 to roughly $3, signaling less acute tightness rather than oversupply.
- Upstream investment has been cut roughly 20 to 30% versus the pre-Covid peak, leaving each new project needing a higher break-even and underpinning a 'high-floor' price regime the market underprices.
Understanding this disconnect is essential for adjusting energy exposure and hedges. Across financial flows, inventory levels, global demand dynamics and the rate cycle, the price signal alone is not enough.
Brent crude: how to interpret the 2025 price retreat and recalibrate strategy across geopolitical risk, inventories, demand and the monetary cycle.
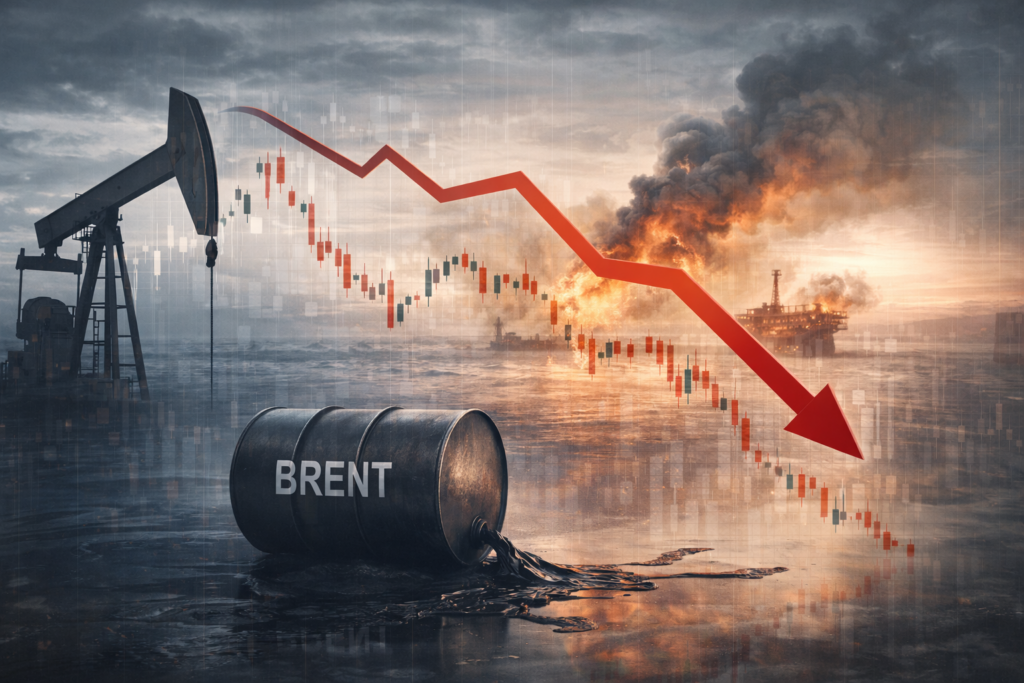
Brent in Retreat: Genuine Easing or Pause Before Renewed Tension?
Since early November 2025, Brent has shed nearly 15% after a peak close to ≈$98/barrel in late October, returning to around $82–85/barrel by mid-December. This downward move occurred even as Middle East tensions persist and Red Sea corridor security remains fragile for maritime trade.
Brent remains the global pricing reference for physical oil. Its level directly shapes transport costs, industrial margins, imported inflation and asset allocation trade-offs. For a structural reading, the analytical framework on commodities in the global economy provides the essential reference points.
The key issue is the current divergence: a price softening while several physical indicators — available inventories, spare capacity, geopolitical risks — remain stretched. This gap is where the main trade-offs lie for investors and energy-exposed companies.
Put differently, the recent decline reflects financial repositioning (profit-taking, rotation into rate markets) as much as a genuine loosening of supply-demand fundamentals. Equating “falling price” with “dissipated risk” yields an incomplete reading of the market.
The Trigger: A Market Correcting Despite Geopolitics
Over the past seven days, the Brent futures curve has flattened slightly: the spread between the front month (January 2026) and late-2026 contracts narrowed from roughly $6 to ≈$3. This signals a market that is somewhat less acutely tight, but far from showing massive oversupply.
At the same time, headline euro area inflation fell below 2.2% in November 2025 (after peaks above 8% in 2022), while central banks are only beginning to ease policy rates marginally after the 2022–2024 tightening cycle. This backdrop feeds a consensus: soft but positive growth, contained oil demand, better-managed risks, hence Brent assumed to remain stable or modestly weaker in the $75–85 range.
Part of the consensus rather expects oil to be capped by a combination of energy-efficiency gains and Asian-demand normalization. The analysis presented here diverges on one key point: structural supply fragility looks underappreciated relative to the reassuring “soft landing” macro reading.
The Real Mechanisms Behind Brent Pricing
Supply: Spare Capacity Less Comfortable Than It Appears
Since 2020, the oil industry has invested far less than during the 2010–2019 decade. Exploration-and-production spending has been cut by roughly 20–30% versus the pre-Covid peak, under the combined pressure of shareholders (capital discipline) and climate policies.
- OPEC+ spare capacity: current estimates are around 3–4 million barrels per day mobilizable within months.
- Global demand: ≈103 million barrels per day in 2025, a fresh record despite the rise of electric vehicles.
The spare-capacity-to-demand ratio is lower than in 2015–2018, when the market was significantly more comfortable. In other words, a sequence of small shocks (logistical disruptions, accidents, regional escalation) is enough to push the Brent risk premium higher.
Demand: A Deceptive “Softness”
On the demand side, global growth is estimated around 2.5–3% for 2025, with industrial deceleration in Europe but resilient US consumption. As long as global GDP advances at this pace, oil demand rarely contracts; at best, its growth slows.
This scenario assumes that energy efficiency and electrification gradually offset new requirements. But the process is slow: the internal-combustion vehicle fleet, aviation and maritime freight remain heavily oil-dependent. Even under accelerated transition assumptions, global oil demand declines meaningfully only beyond 2030 in most projections.
The Role of Rates, the Dollar and Financial Flows
Elevated interest rates between 2023 and 2025 raised storage and hedging costs, prompting some participants to trim long Brent positions. In parallel, adjustments in rates and equities markets pushed several funds to tactically reduce commodity exposure to lock in gains.
When managers judge that future inflation risk is receding, they mechanically reduce oil positions used as a hedge. This is a still-misread parameter: a portion of the Brent retreat reflects financial flows more than a clear signal on physical fundamentals.
This gap between financial signals and physical constraints comes into focus when placed within the logic of real commodity cycles and their macroeconomic transmission, where energy prices respond less to immediate conjuncture than to investment trade-offs, capacity, and geopolitical frictions.
The Core User Question: Opportunity or Mid-Term Trap?
What many readers really want to understand is whether the current Brent decline is a window to gain exposure (or hedge) on attractive terms, or instead the start of a durably lower cycle. The real question is less whether Brent prints $75 or $90 in coming weeks, and more whether the average price regime over the next 3–5 years will sit closer to $70–80 or to $90–100.
If current dynamics persist — limited new investment, constrained spare capacity, latent geopolitical tensions — the probability of a “high floor” price regime remains significant. The market does not fully price this possibility because the focus stays on the rate cycle and disinflation.
Common Errors in Reading the Brent Market
- Confusing a price correction with the end of risk: seeing Brent drop 15% and concluding that supply tension is resolved. This reading is misleading because it ignores the role of speculative flows; the proper approach is also to monitor inventories and spare capacity.
- Overstating the immediate impact of electric vehicles: believing that EV adoption is already producing a structural fall in oil demand. In reality, growth in air travel, freight and emerging-market consumption more than offsets it in the short run.
- Ignoring the cost of capital: assuming that new oil projects will always arrive in time. With real rates still positive and tighter ESG constraints, each new project requires a higher break-even price, which supports the Brent floor.
Three Plausible Trajectories for Brent
Scenario 1 — “Relative Comfort” Plateau (Moderate Probability)
Assumption: global growth around 2.5%, no major geopolitical shock, relatively stable OPEC+ production discipline, slow continuation of energy-efficiency gains.
Implication: Brent oscillating mainly within a $75–90 range through 2027, with episodes of volatility but no sustained break above $100. This scenario is close to the central view of many participants today.
Scenario 2 — Recurring Supply Tension (Underappreciated Scenario)
Assumption: repeated incidents on maritime routes (Red Sea, Strait of Hormuz), investment delays, climate shocks affecting certain producers’ supply.
Implication: a sequence of sharp peaks at $100–110, with intermittent returns toward $85–90 but rarely sustained below $80. This scenario rests on the view that the structural safety margin of the oil system is thinner than current pricing reflects.
Scenario 3 — More Pronounced Energy Landing (Risk to Monitor)
Assumption: a sharper-than-expected global slowdown (world growth near 1.5%), accelerated energy substitution, weaker OPEC+ discipline.
Implication: Brent reverting durably toward $65–75, with rarer peaks. Not the central scenario today, but it would gain credibility on unexpected monetary tightening or a Chinese demand shock.
A diffuse but growing risk: monetary policy held tighter than currently anticipated, combined with a risk-asset correction, could force a more violent unwind of long commodity positions, accelerating a transition toward Scenario 3.
Practical Implications for Investors and Companies
For Investors: Position Sizing and Horizon
- Allocation context: in diversified portfolios, direct or indirect oil exposure (commodity ETFs, producer equities, oilfield services) has historically been observed in the low single-digit-percent range as a partial hedge against energy-tension scenarios. The exact weight observed varied widely with mandate constraints and risk tolerance.
- Timing: the late-2025 pullback can serve to build positions progressively, fractioning entries and retaining liquidity to add if Brent slips back below $80.
- Risk management: instruments without excessive leverage and diversified across the energy chain have historically been observed to absorb idiosyncratic shocks better than concentrated bets on one or two producers.
For Energy-Consuming Companies
- Gradual hedging: spreading forward purchases over 6–18 months rather than hedging massively at a single price level. Brent around $80–85 remains historically “neutral” relative to the 2011–2014 and 2018–2019 averages.
- Embedding the cost of capital: projects heavily dependent on fuel (logistics, aviation, road transport) warrant stress testing under a multi-year Brent $95–100 scenario, not only against today’s lows.
For Households
- Indirect impact: fuel prices, airfares, imported goods. A Brent rebound toward $100 could reactivate part of the inflationary pressure.
- Practical takeaway: integrating energy into the broader investment reflection through diversified exposures (limited oil weight, alongside other commodities or energy-transition winners and losers).
Key Indicators to Watch on Brent Crude
- OECD commercial oil inventories: a continuous decline over several months despite Brent softness would signal a structurally tight market.
- Spread between spot and 12-month futures (curve structure): a return to deep backwardation (spot pricier than far-dated contracts) would indicate immediate supply tension.
- Global growth differential: world GDP drifting toward 2% or below in 2026 would argue for greater risk of Scenario 3 (sharper energy landing).
- OPEC+ production decisions: any surprise quota cut announced amid already-elevated prices would reinforce the probability of Scenario 2 (recurring tension).
Specific Reader Questions
Is the late-2025 Brent retreat enough to durably reduce inflation?
A one-off Brent decline helps cool short-term inflation, especially in energy and transport. But durable disinflation also requires energy-price expectations to remain anchored and other components (wages, rents) not to reaccelerate. Further detail: The long-history of gold expressed in oil terms.
Is buying an oil-linked ETF after a 15% correction reasonable?
It depends on horizon and risk tolerance. For a 3–5-year horizon and a moderate allocation (a few percent of the portfolio), the correction can offer an interesting entry, provided entries are spread over time and the strategy does not depend on a single scenario.
How can a small-to-medium industrial firm hedge against a Brent rebound?
By combining partial fixed-price contracts, forward purchases on a fraction of needs, and price-revision clauses with its own customers. The aim is not 100% coverage but capping part of the risk in case of a shock.
Do oil majors still benefit from rising Brent as before?
They still gain clearly, with nuances: regulatory constraints, heavier taxation and investor pressure on transition can limit the direct pass-through from Brent to share prices. Hence the importance of company-by-company analysis.
Conclusion: A Less Visible Risk, Therefore Easy to Underestimate
The late-2025 decline in Brent does not mean the energy risk is behind us. It reflects a positioning adjustment in a context of disinflation and reshuffled financial flows more than a deep rebalancing between physical supply and demand.
This is not the central scenario today, but a regime of durably elevated prices — with recurring spikes above $100 — remains plausible if investments stay constrained and geopolitical tensions persist. The market is not fully pricing this possibility, which opens both allocation opportunities and risks of underhedging.
For investors, the challenge is to calibrate measured oil exposure within a global portfolio, accepting volatility but avoiding excessive bets. For companies, the key is integrating a “high-floor” Brent scenario into margin and pricing calculations. For households, the impact will mainly come through cost of living and purchasing power, at the intersection of energy markets, inflation and rates.
- Three takeaways
- The recent Brent retreat owes as much to financial flows as to fundamentals: supply remains structurally tight despite the apparent calm.
- A “high-floor” price regime (≈$80–100) remains underappreciated, especially if investments stay constrained and geopolitical tensions recurrent.
- Measured Brent exposure has historically been observed as a partial energy hedge in diversified portfolios, provided entries are smoothed and inventories and curve structure are monitored.
Last updated — 12 July 2026
Disclaimer – Financial Information: The analyses, commentary, and content published on eco3min.fr are provided for informational and educational purposes only. They do not constitute investment advice or a solicitation to buy or sell financial instruments. Past performance is not indicative of future results. All investment decisions involve risk and are the sole responsibility of the reader.
Read next
Full pillar →Reading the refinery utilisation rate: the threshold, the season, the turnarounds
A refinery runs full near ninety percent, not a hundred: the last slice of nameplate capacity is a…
IMO 2020: the regulatory shock that rewrote product spreads
An environmental rule on marine sulfur can move a refining spread more than a swing in crude. IMO…
The 2022–2023 refining golden age: anatomy of an episode
In 2022, refined fuel prices climbed faster than crude. That gap, measured by the 3-2-1 crack spread, reached…


