
The Gold/Oil Ratio: How Many Barrels an Ounce Buys

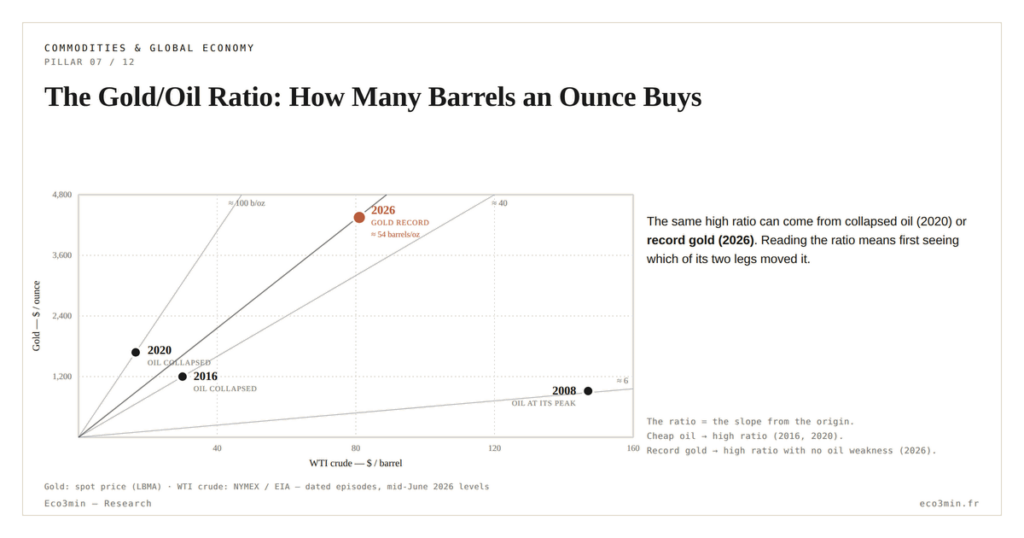
The gold/oil ratio measures how many barrels of crude one ounce of gold buys. It sets a monetary asset against an energy asset, and its level signals which of the two regimes, safe-haven or inflation, prevails at a given moment.
TL;DR
From under 7 barrels an ounce in 2008 to nearly 102 in April 2020 and about 50 in mid-2026, the gold/oil ratio's swings reveal whether energy or money is moving.
- In 2026 the ratio near 50 is high because gold set records ($5,020 in February on a monthly average, $4,228 in June, World Bank Pink Sheet), not because crude is cheap; WTI still traded near $80 to $94 in mid-June.
- Because both metals are quoted in dollars, the ratio cancels the currency by construction, isolating the real energy-versus-metal relationship rather than dollar strength.
But that level must be decomposed before it is read: the same high ratio can come from collapsed oil or from gold at a record. The distinction changes everything.
Mid-2026: one ounce for nearly 50 barrels
In June 2026, an ounce of gold traded on average for the equivalent of about fifty barrels of WTI: gold averaged $4,228 over the month (World Bank Pink Sheet) and US crude $84.81 a barrel (EIA spot average), or nearly 50 barrels an ounce, after a spike to $114.58 on 7 April during the war involving Iran and a retreat as de-escalation took shape. That level is high by historical standards: over the long run, the monthly median since 1986, computed on the same two sources, is 18.5 barrels an ounce, with half of all months between 13 and 25.
Such a high ratio suggests, at first glance, oil that is cheap relative to the metal. The 2026 reality is the opposite: crude remains expensive in absolute terms, and it is gold, driven to successive records, that pulls the ratio up. Hence a reading rule: the ratio’s level says nothing until one has identified which of its two legs moved it.
The ratio has, moreover, no equilibrium value to which it mechanically returns. Its average has drifted across the decades, as gold demonetized after 1971 then regained a reserve role in the 2000s. Speaking of a normal level makes little sense: what matters is the direction and the cause of the move, not the gap to a fragile historical mean.
The distinction is not academic. In 2026 crude had a turbulent year: driven above $110 at the height of the war involving Iran ($114.58 on 7 April), then pulled back toward $85 by hopes of a deal and the prospect of the Strait of Hormuz reopening. Meanwhile gold followed its own path, dictated by real rates and monetary distrust. The ratio thus moved for reasons that owe as much to oil as to the metal. Further detail: how gold tracks the real-rate regime.
The reading convention matters too. Expressed in barrels per ounce, the ratio rises when gold dearens or oil falls; some present it the other way, in ounces per barrel, where the signal inverts. Beyond presentation, the content is identical: a price ratio between two real assets whose drivers differ. Related work: our study on the copper-gold ratio and yields.
Two assets, two engines
Oil and gold answer to different forces. Crude is a real-economy asset: its price depends on industrial demand, OPEC+ decisions, inventories and supply disruptions. It rises when activity accelerates or a supply shock hits, and collapses when demand contracts. As such, it is one of the most direct markers of energy-driven inflationary pressure. Related material: reading copper and crude as physical markets.
Gold follows another logic. Without yield or a dominant industrial use, it responds first to real rates and distrust of currency: it is gold as a reserve asset that makes it the vessel for savings in periods of monetary stress. The gold/oil ratio thus sets two barometers face to face: one of energy and inflation, the other of monetary confidence. Eco3min ties this point to the gold-silver pair in our framework for the gold/silver ratio across regimes.
This difference in nature explains why the two assets often diverge at the worst moment. A geopolitical shock that sends crude soaring can simultaneously lift gold if the market fears inflation or instability; but a recession that collapses oil demand also supports gold, through the fall in real rates it brings. The ratio captures precisely the gap between these two responses, rarely in sync.
The two legs do not, moreover, move at the same tempo. Oil has violent, brief bursts: a supply shock or a logistical rupture can double its price in weeks, then unwind as fast. Gold moves in slow waves, along monetary cycles that stretch over years. The ratio thus blends a nervous denominator and an inert numerator, which makes its downward spikes, tied to oil, more sudden than its upward drifts, tied to the metal.
One merit of the ratio lies in its monetary neutrality. With both gold and oil quoted in dollars, the ratio cancels by construction the moves of the US currency: a rise or fall in the greenback affects both prices in the same direction and drops out of the quotient. What the ratio isolates is therefore the real relationship between energy and metal, independent of the dollar’s own value.
The extremes speak: 2008, 2016, 2020
Turning points illuminate the mechanism better than averages. In the summer of 2008, when the barrel peaked at $145.31 on 3 July, WTI’s all-time spot record, while gold hovered around $900, the ratio fell to 6 or 7 barrels per ounce (6.6 on average in June 2008, the lowest monthly reading since 1986): energy crushed everything, in a world economy still overheating before the crisis. Conversely, in early 2016, oil collapsing below $30 against gold near $1,200 drove the ratio toward 40 barrels per ounce on average in February 2016.
The spring of 2020 delivered the modern extreme. With demand collapsing during the pandemic, WTI even settling in negative territory on 20 April 2020, and gold held around $1,700 by the flight to safety, the ratio climbed to nearly 102 barrels per ounce on average over April 2020, the highest monthly reading since 1986. How such shocks transmit to the economy is detailed in the analysis of the oil burden on GDP; the full series appear in the gold/oil ratio dataset maintained by Eco3min.
Earlier decades confirm the range. At the height of the oil shocks in the late 1970s, a barrel multiplied tenfold had crushed the ratio despite gold itself surging; the 1986 counter-shock, which sent crude below $15, lifted it sharply instead.
The 1990s offer the mirror image of 2008. Durably cheap oil, at times below $15 in 1998, against a gold price also depressed near $290, kept the ratio in an intermediate zone, between 17 and 26 barrels per ounce in 1998. Neither energy shock nor major monetary stress: the ratio simply reflected two real assets in dormancy, far from the extremes that make it eloquent.
The recent cycle illustrates this inertia of the numerator. Between 2022 and the early-2026 record, gold rose from about $1,800 to $5,020 on a monthly average (February 2026, World Bank Pink Sheet), driven by heavy central-bank buying and a de-dollarization move. That ascent re-based the ratio structurally, independently of oil: even expensive crude, as in 2026, no longer suffices to bring the ratio back toward its historical low band.
Decompose the level, rather than read it raw
From these episodes emerges the indicator’s main limit: the same level covers opposite situations. A high ratio can result from distressed oil, a sign of recession or glut, or from gold lifted by a monetary crisis. The two readings contradict each other, and only examining both prices in level settles it. The 2026 ratio, near 50, illustrates the trickiest case: it is high not because energy is collapsing, but because gold is setting records. Reading which leg moved is exactly what 620 months of the gold-copper ratio ranked since 1975 makes possible.
Part of market commentary mechanically reads a high ratio as a sign of oil weakness or a coming slowdown. The reasoning neglects the monetary leg: since 2022, central-bank gold demand and the search for a hedge have inflated the numerator independently of the energy cycle. What would move the ratio from here rests on two distinct sets of variables: on the metal side, the path of real rates and official demand; on the crude side, the supply-demand balance, OPEC+ decisions and geopolitical risk. A related perspective: our analysis of investing in gold.
One point deserves attention, provided it is not over-read. The lowest ratios, those where oil dominates, have at times coincided with the approach of recessions: 1979 and 2008 pair an expensive barrel with a turn in the cycle, dearer energy weighing on purchasing power and margins. But the relationship is nothing mechanical: in 2005 the ratio fell to 6.8 barrels per ounce (August average) with no recession, and a low ratio never, on its own, amounts to a forecast.
The same caution applies to other cross-commodity ratios. The copper-to-gold growth gauge sets industrial metal against safe haven; placed within physical commodity and energy markets, these ratios form a regime grid, provided one always distinguishes which component carries the move.
A regime barometer, to be interpreted
The gold/oil ratio remains a useful marker: few indicators sum up so simply the tension between the energy economy and the monetary sphere. Its strength is its legibility; its weakness, the ambiguity of its level, which each time requires going back to the two prices that compose it.
Taken for what it is, the ratio chiefly illuminates the composition of a move. Seeing gold and oil side by side forces one to ask, at each swing, whether it is the real economy or the monetary sphere speaking, a question that neither the price of crude nor that of the metal, taken alone, settles.
In September 2026, with gold at $4,319 on a monthly average (Pink Sheet) and WTI at $97.31 (EIA average), the ratio was back near 44: the rebound in crude did the work gold no longer did. Several configurations remain open from these levels. A lasting calm in the Middle East would weigh on crude and keep the ratio high; a retreat in gold, conversely, would bring it down with no energy shock at all. The ratio describes a regime; it does not predict one.
- The gold/oil ratio measures how many barrels of crude one ounce of gold buys; it sets a monetary asset against an energy asset.
- Its extremes are telling: under 7 barrels per ounce in summer 2008 (oil at $145), close to 102 in April 2020 (demand collapse).
- The same level can come from cheap oil or dear gold: in 2026, a ratio near 50 reflects gold’s strength, not crude weakness.
Last updated — 7 October 2026
Disclaimer – Financial and Legal Information: The analyses, commentary, and content published on eco3min.fr are provided for informational and educational purposes only. They do not constitute investment advice or a solicitation to buy or sell financial instruments. Past performance is not indicative of future results. All investment decisions involve risk and are the sole responsibility of the reader. Data, charts and calculated series are provided as is and may contain errors or lag behind their source: check any figure against the primary source cited before relying on it. Content describing laws, regulations or contracts reflects the law as of its publication date and does not constitute legal or tax advice; applying it to a specific situation requires a qualified legal or tax professional.
Read next
Full pillar →Gold as a Monetary Signal: Real Yields, the Dollar and Central Bank Buying
Gold prices do not track inflation: they track the monetary opportunity cost of holding, itself driven by real…
Pure-play refiners versus integrated majors: downstream margin exposure
A pure-play refiner owns only the downstream, so its earnings track the refining margin. An integrated major also…
Jet fuel, the forgotten margin: the jet crack and the aviation link
The 3-2-1 crack spread reduces the refining margin to two products, gasoline and diesel. Jet fuel sits outside…