
Diesel versus gasoline: why the two crack spreads diverge

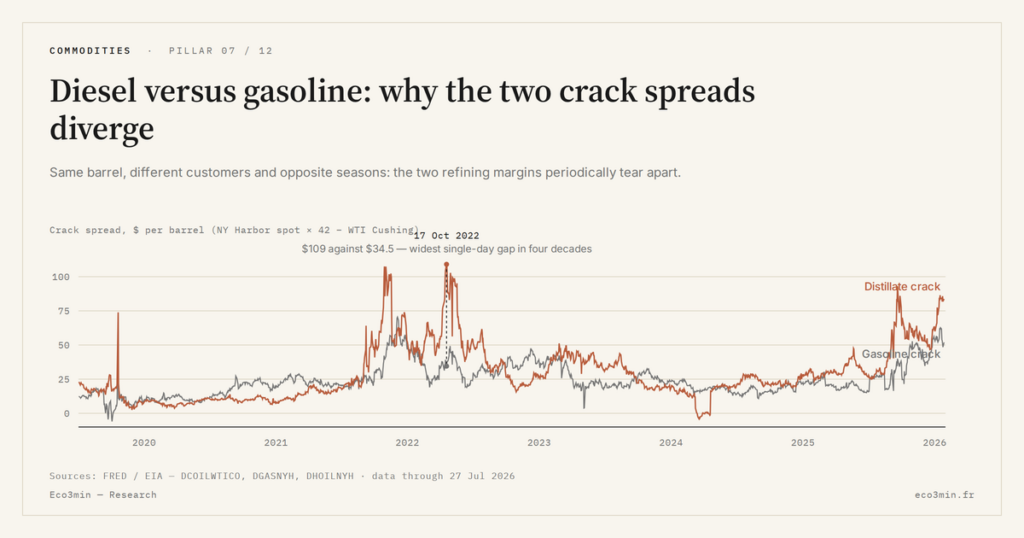
The 3-2-1 crack blends gasoline and distillate into a single number, and that convenience hides something the market cares about a great deal: the two fuels do not always earn the same margin. Most of the time they move together, but they answer to different customers and to opposite seasons, and every so often they tear apart. 2022 was the textbook case, and it was a distillate story from start to finish.
This page splits the blended crack into its two legs and asks why they diverge. It is the product-by-product companion to the 3-2-1 crack spread explained, which sets out the recipe itself.
In short
Gasoline and distillate margins usually track each other, but their seasons are opposite and their end-demand is different, so they periodically split apart.
- Over 1986–2026 the two cracks are closely correlated (about 0.79 daily), yet gasoline margins peak in the spring driving season and distillate in the autumn and winter heating season.
- In 2022 they decoupled hard: the distillate crack averaged roughly $55 per barrel against about $34 for gasoline, and on 17 October 2022 it reached $109 while gasoline sat at $34.5, the widest single-day gap in four decades.
- The split runs both ways: gasoline led in 2021, and after Hurricane Katrina in 2005 its crack ran about $51 per barrel above distillate. Divergence is driven by product demand, not by the barrel.
Start with the point that makes the divergence surprising: on a daily basis over four decades, the gasoline and distillate cracks are correlated at about 0.79. They rise and fall together most of the time, because they share the same crude cost and because a refinery can shift its yield between the two within limits, arbitraging away large gaps. When the two cracks pull apart and stay apart, it means something on the demand side has overwhelmed that arbitrage. Between two cities the same test applies, and the pump premium Los Angeles pays over New York City has stayed open since 2000.
Two fuels, two customers
Gasoline and distillate leave the same refinery but serve different economies. Gasoline is the household fuel: passenger cars, discretionary trips, holidays, sensitive to the weather and to the calendar, with demand that swells in the summer driving season. Distillate is the family that contains diesel and heating oil: it powers trucks, trains, farm equipment, construction and industry, and it heats buildings in winter. Diesel is the economy’s workhorse, gasoline the household’s discretionary spend, and the two demand curves rarely peak at the same moment.
That difference in customers is why the cracks can diverge without the crude price doing anything unusual. A freight boom lifts diesel while driving is flat; a cold snap lifts heating oil while gasoline sleeps; a travel-heavy summer lifts gasoline while industry idles. Each pulls one leg of the crack without the other.
Opposite seasons
The clearest structural driver of divergence is the calendar. Averaged across the whole history, the gasoline crack is strongest in spring, ahead of and into the driving season, and weakest in the depths of winter. The distillate crack does the reverse, firming through the autumn and winter heating season and easing in high summer.
AVERAGE CRACK BY SEASON, 1986–2026 ($/BBL)
| Gasoline crack | Distillate crack | |
|---|---|---|
| Spring peak (May) | $15.0 | $12.9 |
| High summer (July) | $12.5 | $10.6 |
| Autumn (November) | $9.7 | $14.4 |
| Deep winter (December) | $8.4 | $13.2 |
Monthly averages, Eco3min US crack series (WTI, RBOB gasoline, ULSD distillate). Gasoline peaks around the driving season, distillate around the heating season.
These seasonal averages are gentle, a few dollars either way, precisely because refiners flex their output to chase the stronger margin. The seasonal pattern sets the baseline; a genuine divergence happens when a demand or supply shock pushes one leg far beyond what yield-switching can offset.
2022: the distillate supercycle
2022 was that shock, and it landed almost entirely on the distillate side. Across the year the distillate crack averaged about $55 per barrel against roughly $34 for gasoline, a gap of some $20 per barrel, the widest annual separation in the whole series. It peaked on 17 October 2022 at $109 per barrel while the gasoline crack that same day was $34.5, a single-day gap of about $75 that has no rival in four decades of data.
The causes stacked up on diesel specifically. Distillate inventories had run down to multi-decade lows heading into winter; refinery closures since 2020 had removed distillate-capable capacity from the system; the loss of Russian diesel and gasoil flows after the invasion tightened the Atlantic basin; and freight and industrial demand stayed strong. Gasoline, by contrast, was capped: pump prices had already climbed far enough to dent driving demand, so its crack, though elevated, never ran away the way distillate did. The wider anatomy of that year sits in the 2022–2023 refining golden age.
When gasoline leads instead
It would be wrong to read 2022 as proof that diesel always wins. The divergence cuts both ways. In 2021, as post-pandemic driving recovered faster than industry and heating, the gasoline crack averaged about $21 per barrel while distillate lagged near $12, gasoline leading by roughly $9. And in a sharper episode, when Hurricane Katrina knocked out Gulf Coast refining at the end of August 2005, the gasoline crack ran about $51 per barrel above distillate on 31 August, the widest gap the other way in the record. Whichever fuel faces the tighter supply or the stronger demand takes the lead.
Reading the split
Because the 3-2-1 averages the two legs, it can look calm while one of them is on fire, which is the practical reason to watch the product cracks separately. Analysts read a widening gap between the two as a signal that one fuel’s balance has tightened relative to the other, a descriptive relationship observed across the record rather than a forward rule. The daily series behind both legs is the US 3-2-1 crack spread dataset; the retail end of each fuel sits in the US diesel and US gasoline price datasets. The broader link from these margins to profits is set out in refining margins as the hidden driver of oil profits.
Frequently asked questions
Why do diesel and gasoline margins usually move together?
They share the same crude input and come out of the same refineries, which can shift yield between the two within limits. That common cost and that flexibility keep the two cracks correlated at about 0.79 on a daily basis, so most of the time they rise and fall in step.
What made 2022 so unusual for diesel?
Several distillate-specific pressures arrived at once: multi-decade-low inventories, lost distillate capacity from refinery closures, the removal of Russian diesel flows, and firm freight demand. Gasoline faced no equivalent squeeze, so the distillate crack pulled far ahead, peaking at $109 per barrel in October 2022.
Does the gasoline crack ever exceed the distillate crack?
Yes. In 2021 gasoline led as driving recovered, and after Hurricane Katrina in 2005 the gasoline crack ran about $51 per barrel above distillate. The lead simply follows whichever fuel is tighter at the time.
Why does the seasonality of the two cracks differ?
Their peak-demand seasons differ. Gasoline demand rises in the spring and summer driving season, so its crack tends to firm then; distillate demand rises in the autumn and winter heating season, so its crack tends to firm later in the year.
Go deeper
- How throughput shapes both legs: reading the refinery utilisation rate.
- The determinants of margins generally: the drivers of refining margins.
Sources
- Eco3min US crack series (WTI, RBOB gasoline, ULSD distillate), daily, 1986–2026; product cracks and correlation computed from this series.
- U.S. Energy Information Administration, distillate and gasoline stocks and product supplied.
Last updated — 20 September 2026
Disclaimer – Financial Information: The analyses, commentary, and content published on eco3min.fr are provided for informational and educational purposes only. They do not constitute investment advice or a solicitation to buy or sell financial instruments. Past performance is not indicative of future results. All investment decisions involve risk and are the sole responsibility of the reader.
Read next
Full pillar →IMO 2020: the regulatory shock that rewrote product spreads
An environmental rule on marine sulfur can move a refining spread more than a swing in crude. IMO…
The 2022–2023 refining golden age: anatomy of an episode
In 2022, refined fuel prices climbed faster than crude. That gap, measured by the 3-2-1 crack spread, reached…
The 3-2-1 crack spread explained: refining margin in one formula
A refinery is, in the crudest terms, a spread trade: it buys crude oil, transforms it, and sells…


