NFCI Above 0.5: How to Read the Financial Stress Threshold

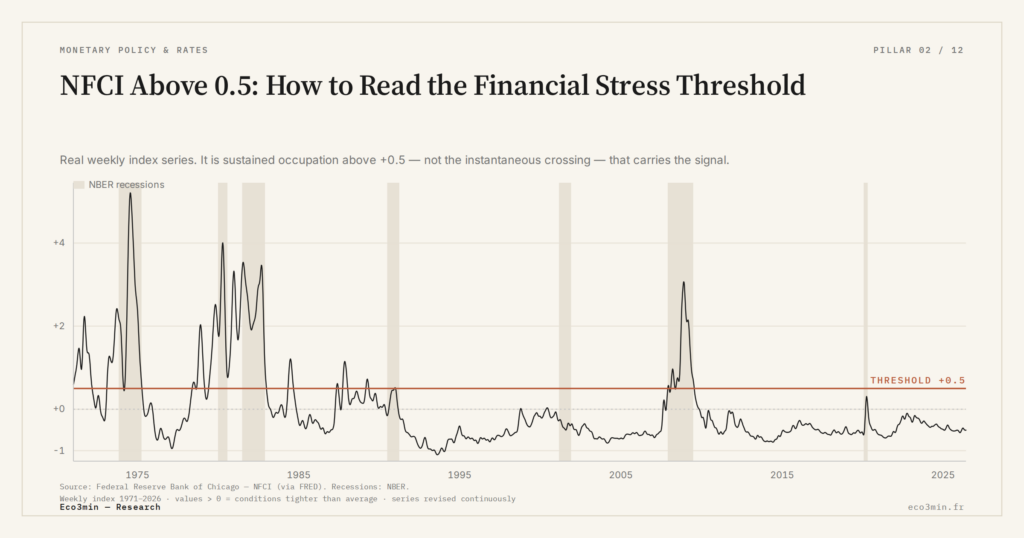
“NFCI above 0.5 means stress signal”: the rule has circulated in strategist notes for a decade. The Chicago Fed never decreed it — it emerged empirically, and its conditions of validity deserve explicit framing.
TL;DR
Every NBER recession since 1971 followed a sustained NFCI move above 0.5, a line the Chicago Fed never set, with lead times collapsing from months to weeks in acute crises.
- The 0.5 line appears in no Chicago Fed methodology paper (Brave and Butters, 2010); it crystallized in post-GFC analytical work, calibrated across 8 NBER recessions with a 6-to-12-month median lead time.
- Crossing from zero to +0.5 widens corporate spreads by 50 to 100 basis points and activates three transmission channels (financing cost, dealer balance-sheet limits, business surveys) that reach the real economy in 2 to 4 quarters.
- Two failures bound the rule: October 2011's +0.6 false positive from the European sovereign crisis with no U.S. recession, and 2022's contested false negative, where the index peaked at +0.4 despite 525 bps of Fed hikes.
- Lead times are bimodal: 6 to 12 months in slow credit cycles, but 2 to 8 weeks in acute systemic crises. In September 2008 the index crossed 0.5 from below in roughly two weeks and 1.0 within a week of Lehman.
The academic origin of the rule, its underlying mechanism, and its empirical limits (2011 false positive, 2022 false negative) structure what the 0.5 threshold truly signals and what it does not.
1. Where the 0.5 threshold comes from: empirical, not regulatory
The 0.5 threshold on NFCI does not appear in the Chicago Fed’s original methodological working paper (Brave and Butters 2010), nor in its 2014 update. The underlying series is published in the NFCI data. The Chicago Fed publishes the index but fixes no official interpretive threshold — its role stops at measurement. The 0.5 is an empirical convention that crystallized in the post-GFC analytical literature, primarily through Chicago Fed Economic Perspectives publications (Brave and Butters 2012 and subsequent work) and several academic studies between 2012 and 2018.
The empirical calibration finding runs as follows: every U.S. recession defined by the National Bureau of Economic Research (NBER) since 1971 has been preceded by a sustained move of NFCI above +0.5, with a median lead time of 6 to 12 months between threshold crossing and the official start of recession. The definition of “sustained move” varies across authors: some require four consecutive weeks, others eight, others a 13-week moving average. The qualitative result is robust to these variations: every cycle passes the test.
This property makes the 0.5 threshold a useful leading indicator, but also an extremely noisy short-term one. An instantaneous move above 0.5, without persistence, signals nothing. It is the duration above the threshold that carries information. This nuance is fundamental to understanding the general NFCI analytical frame and to avoid the reading error that treats threshold crossing as an instantaneous binary signal.
2. The underlying mechanism: why 0.5 has analytical significance
The 0.5 figure is arbitrary in its choice — a rule-of-thumb standard deviation — but the economic mechanism it signals is not. Moving 0.5 standard deviations above the historical mean of financial conditions equates to a significant tightening of financing conditions, sharp enough to alter credit, investment, and risk-taking behavior in the real economy.
Several transmission channels explain why NFCI at +0.5 has a measurable economic effect, while NFCI at +0.2 does not. First, the marginal cost of financing rises: corporate spreads typically widen by 50 to 100 basis points when the index moves from zero to +0.5, which translates into a negative investment elasticity documented in macroeconomic VAR models. Second, balance sheet constraints on market intermediaries begin to activate: primary dealers reduce inventory, hedge funds face margin calls, and market depth declines. Third, surveys of businesses (NACM, ISM) begin to mention financing difficulties, creating a second-round effect on investment decisions.
These three channels do not activate below +0.5 because the financial system has sufficient buffer to absorb a moderate tightening without propagation to the real economy. Above +0.5, buffers deplete, and tightening passes to credit then to investment with a 2- to 4-quarter lag. This lag explains the 6- to 12-month lead time observed empirically between crossing and recession.
The 0.5 rule on NFCI therefore functions as a saturation indicator for the financial system’s buffers — beyond this level, the system begins transmitting stress to the real economy. This is precisely why central banks and finance ministries monitor the index closely, as a financial conditions belt in monetary transmission between markets and the productive economy.
3. The rule’s conditions of validity
The empirical 0.5 threshold rule is calibrated on 55 years of observations and 8 NBER recessions (1973-1975, 1980, 1981-1982, 1990-1991, 2001, 2007-2009, 2020). This calibration assumes three conditions of validity worth making explicit.
First condition: stationarity of the historical mean. NFCI is normalized to have zero mean and unit standard deviation over the entire series. If the underlying financial structure fundamentally changes (for example, post-Dodd-Frank, or with the expansion of private credit outside the banking perimeter), the historical calibration may become partially obsolete. This concern explains why some analysts argue for a threshold recalibration to 0.3 or 0.4 for the post-2010 era — a methodologically legitimate argument that remains in the minority in the literature.
Second condition: inter-sub-index coherence. The 0.5 threshold on the aggregate implicitly assumes the three sub-indices (risk, credit, leverage) move in concert. When the aggregate is pulled primarily by a single sub-index, the 0.5 crossing loses part of its predictive value — precisely what happened in 2022, where the risk sub-index tightened sharply without dragging credit and leverage along.
Third condition: absence of massive central bank intervention. NFCI captures observed financial conditions, which include the effect of Fed interventions. In the presence of exceptional interventions (unconventional QE, emergency facilities like the Section 13(3) Facilities of March 2020), the 0.5 crossing can be brief and rapidly erased — which alters the imminent-recession signal. The 2020 pandemic illustrates this case: NFCI at +1.5 in March, return below zero in eight weeks, a 2-month technical recession rather than a prolonged one.
4. Empirical limits: false positives and false negatives
Two episodes document the known empirical limits of the rule. The reference false positive is October 2011: NFCI reached +0.6 during the acute phase of the European sovereign debt crisis, without a U.S. recession following. Transmission to the U.S. system passed through U.S. money market fund exposure to European financials — a limited channel that did not propagate tightening to the U.S. real economy. This episode illustrates that crossing 0.5 driven by a single sub-index (the risk sub-index in this case) can produce an aggregate above the threshold without a recession signal.
The reference false negative is 2022: facing a 525 basis points hiking cycle of the Federal Funds Rate and inflation at 9.1% in June 2022, NFCI only peaked at +0.4 in October 2022, never crossing the threshold. This episode is still debated: NBER did not officially declare a recession over the 2022-2024 period, but some analysts argue a technical recession occurred in the first half of 2022 (two consecutive quarters of negative GDP). If this reading prevails, NFCI missed a recession signal; if it does not, the rule stays intact. In both cases, the very close approach to 0.5 without crossing signals that the Fed-to-financial-conditions transmission mechanism operated differently than in previous cycles.
Beyond these two reference cases, several borderline episodes deserve mention. The August 2011 European debt crisis episode produced a four-week move above 0.5 on the risk sub-index without aggregate crossing, illustrating that single-sub-index pressure can be absorbed by the others. The October 2008 episode crossed 0.5 from below in roughly two weeks during September 2008, and crossed 1.0 a week after Lehman — an unusually rapid acceleration that violates the “median 6-12 month lead time” property cited above. This violation is not a failure of the rule but an indication that lead times collapse during balance sheet crises, when transmission to the real economy is near-instantaneous rather than gradual. The empirical distribution of lead times is therefore bimodal: 6-12 months for slow-build credit cycles, 2-8 weeks for acute systemic crises. Applying the rule mechanically without distinguishing the two regimes loses information. A related answer: Our rundown of the credit cycle.
A fine empirical analysis of all episodes — true positives, false positives, false negatives — has been conducted on the complete 1971-2026 series in dedicated work that analytically extends the present article through chronological episode-by-episode verification.
5. How to use it without over-interpreting
Rigorous use of the 0.5 rule requires four analytical precautions. First, require persistence of at least four weeks above the threshold before considering the crossing significant — an instantaneous overshoot often reflects a measurement edge from a data publication rather than a regime break. Second, check inter-sub-index coherence: if the crossing is driven by a single sub-index, the signal is weaker and must be weighted accordingly.
Third, do not wait for the crossing as a sole stress indicator. NFCI at +0.3 sustained over six months with a positive slope can be analytically more concerning than an instantaneous spike at +0.6 with no follow-through. Variation speed and persistence matter as much as the level reached. Fourth, cross-read NFCI with other leading indicators — yield curve, SLOOS lending conditions, credit spread dynamics, ISM new orders — to validate or nuance the signal. Single-indicator reading produces excess false signals; multi-indicator triangulation tightens the inference. The 0.5 rule takes on its full meaning in the context of the historical stress episodes documented since 1971, and its application to the present demands parallel reading of the current cyclical context, treated in the article on reading the current regime. For the broader picture: our analysis of liquidity as a pivot variable.
Treating the 0.5 threshold as an instantaneous binary signal discards the rule’s primary information, which is its temporal saturation property. A NFCI that crosses 0.5 for a single week then falls back signals nothing; a NFCI at +0.4 sustained for six months with a positive slope can be analytically more concerning than an isolated spike at +0.6. The rule only works combined with a persistence criterion (at least four consecutive weeks) and verification of inter-sub-index coherence.
Last updated — 12 July 2026
Disclaimer – Financial Information: The analyses, commentary, and content published on eco3min.fr are provided for informational and educational purposes only. They do not constitute investment advice or a solicitation to buy or sell financial instruments. Past performance is not indicative of future results. All investment decisions involve risk and are the sole responsibility of the reader.
Read next
Full pillar →Real Rates: The True Cost of Capital Is Repricing
Why real rates are reasserting themselves as markets' anchor and how to recalibrate investment and financing decisions facing…
Real Interest Rates: The Quiet Signal Reshaping Markets
Real interest rates: why their persistence in positive territory in 2026 is reshaping the rules for bonds, equities,…
OAT-Bund Spread: A Quiet Gauge of French Sovereign Risk
OAT-Bund spread: how this yield gap has become a key signal on French sovereign risk, fiscal policy and…