
Topic
Financial Instability
Financial stress is measurable: it often shows up in volatility and credit spreads before it reaches the headlines. Unlike systemic risk, a structural fragility, instability is an observable state, with triggers, contagion channels and a policy response. The VIX since 1990, the NFCI since 1971, every S&P 500 drawdown since 1950 and crises from 1929 to the 1998 LTCM collapse are read through their indicators.
Where to start
Three reads, in order: the basics, the full mechanism, then what the data says.
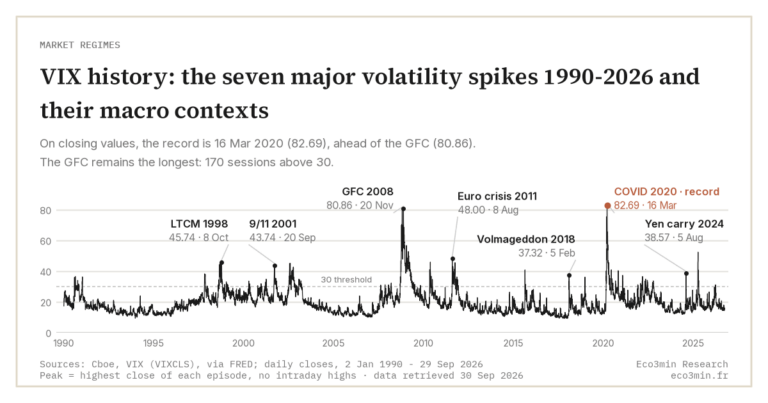 01The basics VIX history: the seven major volatility spikes 1990-2026 and their macro contexts Empirical catalog of the 7 major VIX spikes 1990-2026: LTCM, dot-com, GFC, eurozone, Volmageddon, COVID, yen carry trade unwind. AnalysisRead →
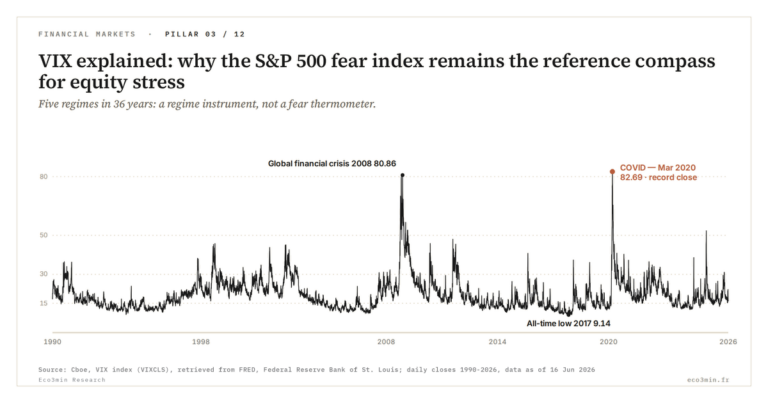 02The full mechanism VIX explained: why the S&P 500 fear index remains the reference compass for equity stress Why the VIX, 30-day implied volatility index of the S&P 500, remains the reference compass for equity stress. In-depth analysisRead →
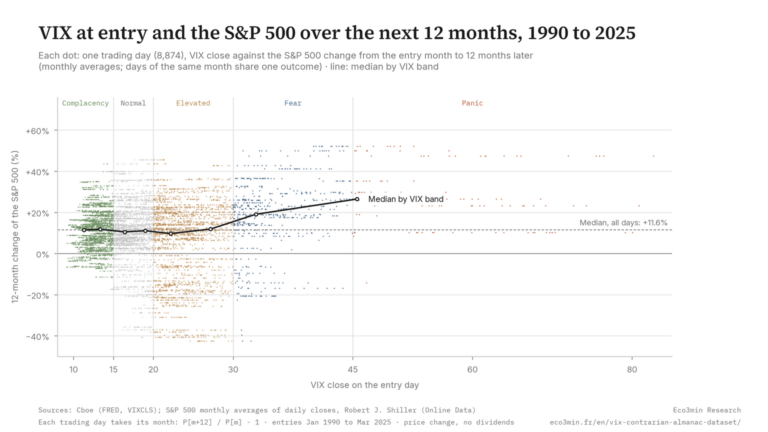 03The evidence The Contrarian’s Almanac: Why Buying Fear Has Outperformed Buying Calm by Nearly 2-to-1 Since 1990 A daily dataset of 9,123 observations mapping VIX volatility regimes to subsequent S&P 500 returns (part of our broader work on market regimes between… StudyRead →
Research and data
Our in-depth research and the downloadable series on the subject.
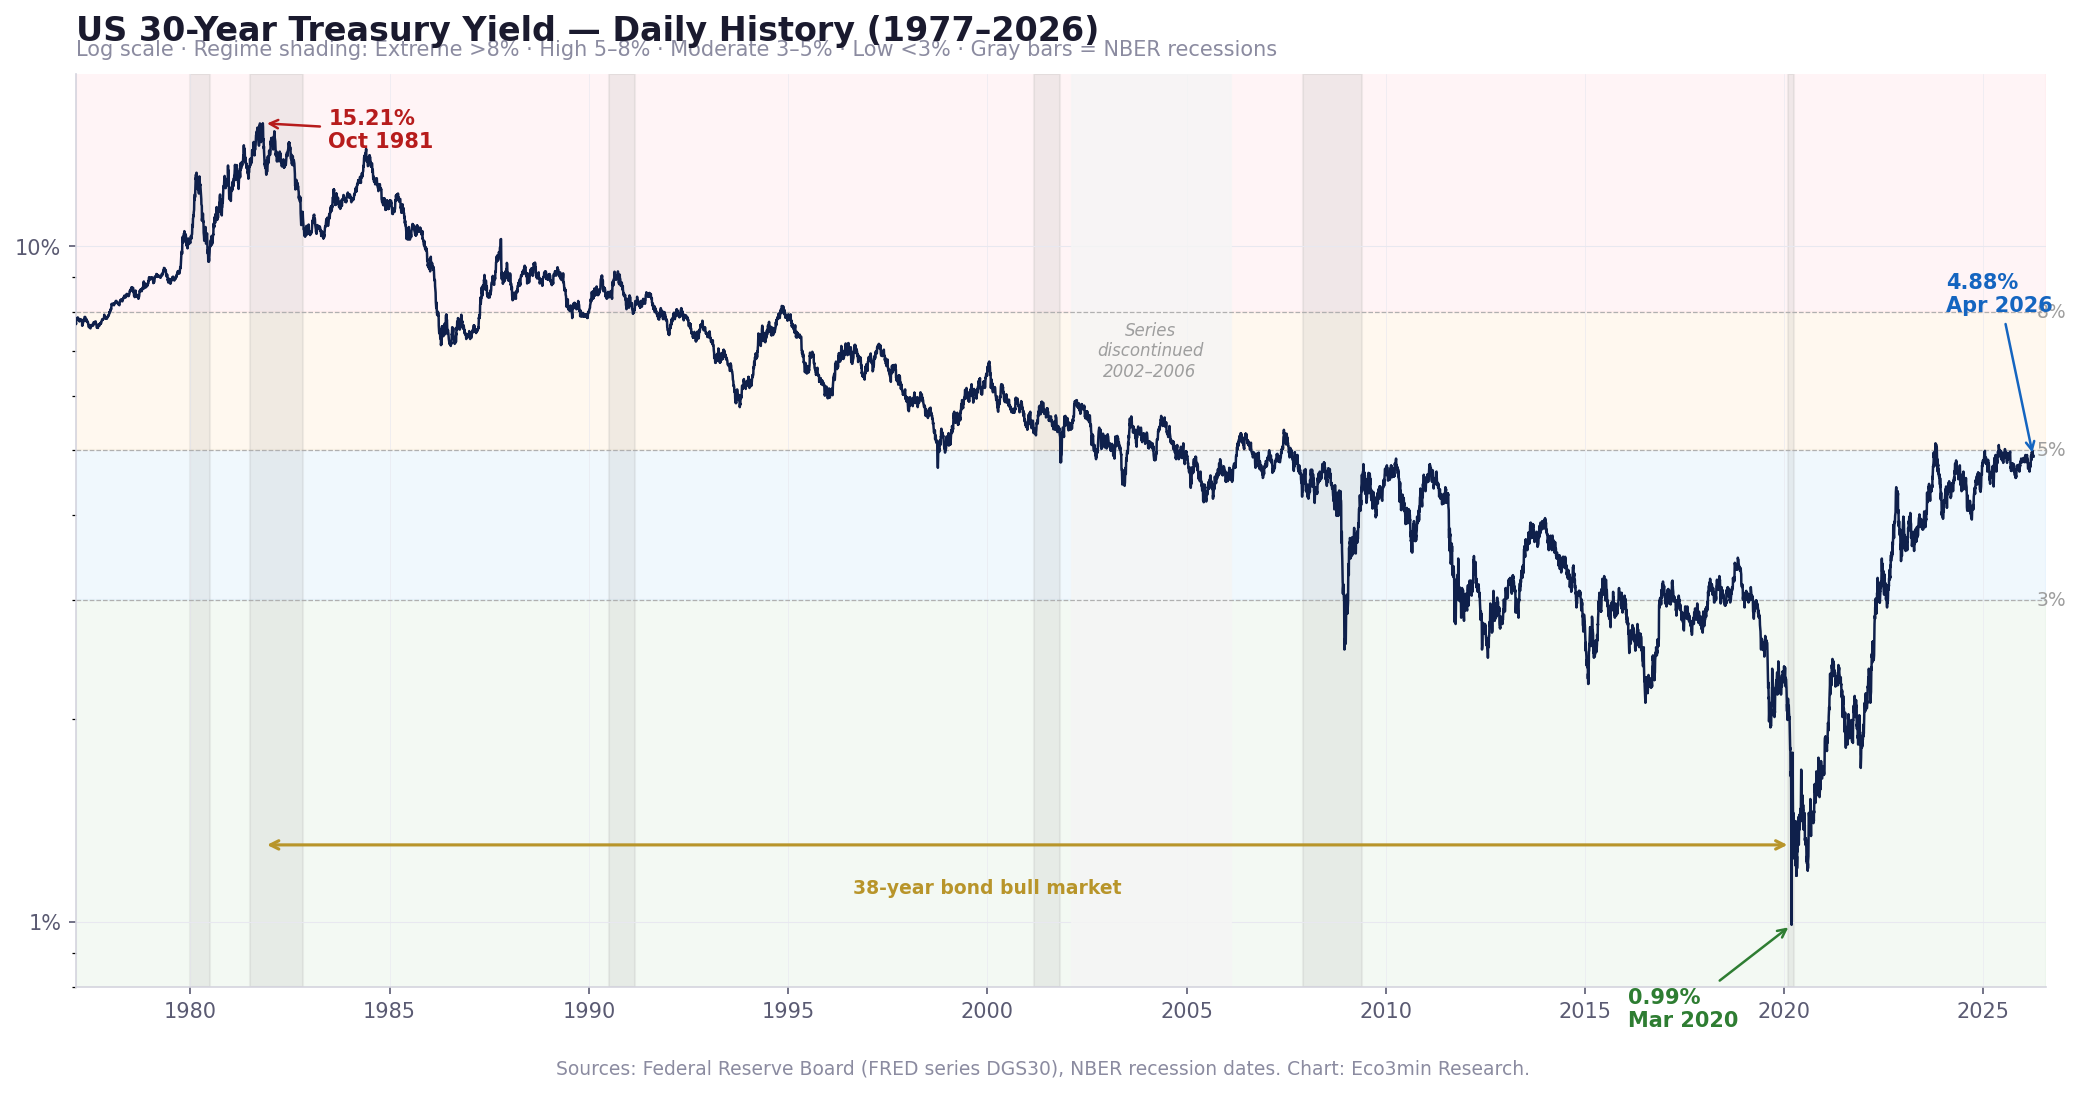 StudyDuration Risk Revealed: The 30-Year Treasury Zero-Coupon Price Declined 70% Between 2020 and 2023, Exceeding Most Equity Bear Markets
All analyses, by angle
Grouped by sub-topic rather than by date. Filter to get straight to the point.
Crisis Hub4
The sub-pillar →- CoreThe 1929 Crash and the Great Depression How, from 1929, the United States shifted into a durable disinflationary contraction: a reading of the Great Depression through the Eco3min indicators. May 31, 2026
- CoreThe 2000 Dot-Com Crash: a regime shift read through the indicators How, between 2000 and 2002, the United States shifted into a disinflationary slowdown, an equity crash of nearly 78% that did not become a credit crisis: read… May 31, 2026
- CoreThe Russia/LTCM crisis of 1998 In 1998, Russia's default and LTCM's collapse trigger a dollar shortage. May 31, 2026
- CoreEvery S&P 500 Drawdown Since 1950: A Catalog of 17 Episodes by Depth, Duration, Recovery, and Macro Regime Research · Equity Markets · Updated September 2026 A reproducible inventory of every S&P 500 decline of 10% or more between January 1950 and September 2026,… May 12, 2026
Other angles12
- CoreWhen Do Commodities Diversify a Stock Portfolio? Evidence From Every Major Drawdown Since 1970 Eco3min Research · Commodities & Cross-Asset Commodities rose 136% while U.S. Jul 3, 2026
- CoreEvery US Dollar Bull and Bear Market Since 1973 Since floating in 1973 the dollar has moved in long swings, not one direction. Jul 2, 2026
- CoreWhy Nickel Is the Most Fragile Base Metal: The 2022 LME Squeeze as Structural Evidence March 2022: LME nickel more than doubled within hours and the exchange cancelled a day of trades. Jun 24, 2026
- CoreCocoa’s 2024-2026 Round-Trip: Anatomy of a Record Boom-Bust and the Fragility of Concentrated Soft Markets For a limited physical imbalance, cocoa more than quadrupled to a record $12,646/t (Dec 2024) before falling roughly 70% by early 2026, when supply cannot… Jun 24, 2026
- CoreWhen Interest Rates Truly Become Dangerous for Markets Interest rates do not become dangerous through their level alone, but through their position in the cycle. Jun 4, 2026
- CoreDoes Tech Fall Harder in Bear Markets? US Tech vs the Market, 1971–2026 US tech vs the US market since 1971 (total returns, Kenneth R. May 12, 2026
- Every US bank failure since 1934 The complete FDIC register of 2,499 US commercial bank failures, from 1934 to 2026, each one set against the rates of its year. Sep 2, 2026
- The 1980 Hunt Brothers Corner: Anatomy of the Largest Silver Squeeze In 1980, the Hunt brothers drove silver up to nearly $50 trying to corner the silver market. Jun 24, 2026
- Volmageddon 2018: when innovation amplifies volatility Products that rebalance daily turn a rise in VIX futures into forced purchases of more VIX futures, at a known hour. May 24, 2026
- VIX 2023-2026: not a compression but a low calm twice broken by violent spikes The VIX averaged 18.9 from November 2024 to April 2026, in line with its long-run mean, yet broke twice in violent spikes, with a record SKEW: a nervous calm. May 19, 2026
- VIX backwardation, contango and the volatility futures term structure The VIX curve, contango or backwardation: what the shape of VIX futures says about the stress regime and the roll yield of volatility ETPs. May 19, 2026
- The +0.5 Rule: What the NFCI’s Conventional Stress Threshold Actually Caught (1990–2026) Since 1990, the NFCI's +0.5 stress threshold gave no sustained lead on four US recessions: coincident in December 2007, never crossed in 2001 or 2020. May 13, 2026
Quick reads
Comparisons and common misconceptions: the essentials in a few minutes.
Related topics
The subjects that most often intersect with this topic in our analyses.