Rental Real Estate in 2026: Buy, Hold or Sell?
Rental real estate in 2026: weighing the buy, hold or sell trade-off in a regime of stabilized rates and rental yields under pressure.

Rental real estate: weighing the trade-off between buying, holding or selling in 2026, between stabilized rates and rental yields under pressure.
TL;DR
In early 2026, French 20-year mortgage rates have settled around 3.25–3.45% after peaking above 4% in late 2023, yet rental yields stay under pressure — performance now hinges on asset selection, not leverage.
- Existing-home prices fell a cumulative 8–10% between mid-2022 and end-2024, then broadly stabilized in 2025 (+0.7% year-over-year in Q3, Insee), with marked regional dispersion.
- Average gross rental yields run 3–5% in tight zones; with credit costs still near 3.3%, net cash flow is frequently negative or break-even.
- The 2024–2025 monetary easing has not restored the pre-2022 model — the driver has shifted from leverage toward micro-location and asset selection.
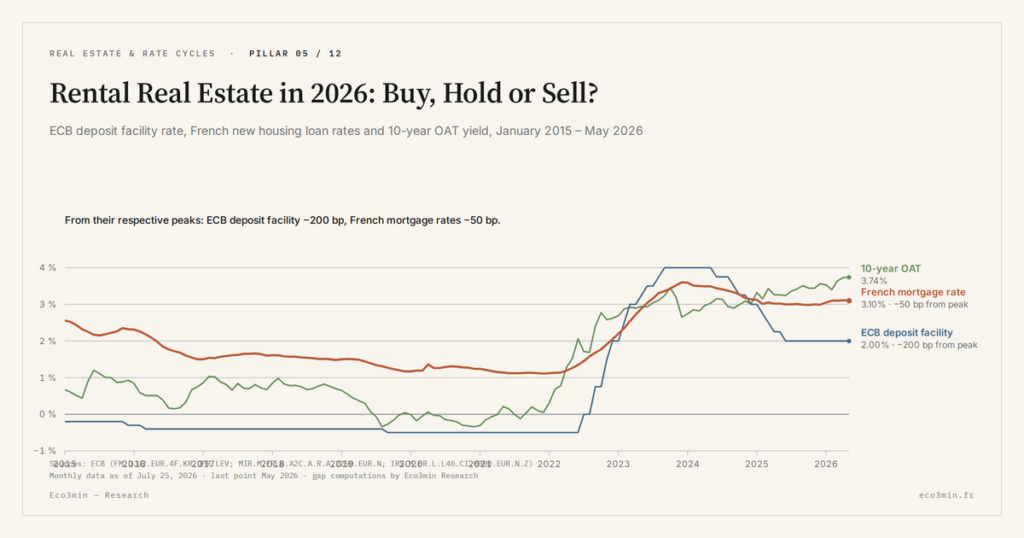
A signal still buried in the noise: despite the monetary easing of 2024–2025 (the ECB took its deposit rate from 4% to 2% between June 2024 and June 2025), leverage is no longer the main return driver. What now separates good files from future traps is cash-flow quality and granular risk management (vacancy, taxation, capex, energy-performance certification or DPE).
What is genuinely shifting the lines in 2026 is the combination of three factors rarely viewed together: capital cost (mortgage rates still well above pre-2022 levels), households’ ability to absorb higher rents (wages, with inflation now contained at 1.7% in the eurozone in January 2026), and rising regulatory pressure on landlords — notably the progressive ban on letting energy-inefficient dwellings. Taken individually, each item looks manageable. Aggregated, they completely redraw the line between good and bad rental real estate. Further reading: the vehicle map for property exposure.
Trigger event: a market in convalescence, not in remission
Between 2022 and 2024, the rapid rise in ECB policy rates (from 0% to 4%) sent credit costs sharply higher. A 1% mortgage over 20 years in 2021 cost around €460 per month per €100,000 borrowed; at the average 3.3% rate of early 2026, the monthly payment is around €570. On a €250,000 rental investment, that is approximately €275 of additional monthly cost relative to the previous regime.
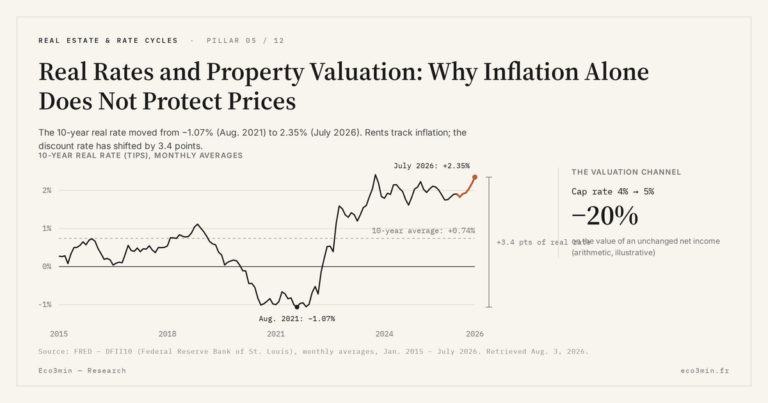
The ECB has since delivered eight rate cuts between June 2024 and June 2025, bringing the deposit facility to 2.00% — unchanged since (five consecutive holds as of February 2026, per the Governing Council statement of February 5, 2026). But this monetary easing has only partially passed through to mortgage rates: the French 10-year OAT, the benchmark for bank refinancing, remains around 3.4%, holding lending rate schedules at an elevated floor.
Concretely, the 2022–2025 cycle has:
- cut transaction volumes by more than 30% between the 2021 peak (≈1.2 million) and the late-2024 trough (≈830,000), before a gradual recovery to ≈920,000–945,000 in late 2025 according to Notaires de France (December 2025 review);
- triggered cumulative price drops of 5% to 12% across cities between mid-2022 and end-2024, followed by stabilization in 2025 (+0.7% year-over-year in Q3 2025 per Insee, with contrasting trajectories: +1.3% for apartments, +0.2% for houses);
- persistently tightened credit access for investors: monthly housing-loan production, although recovering, remains roughly 29% below the 2016–2019 average per Banque de France data.
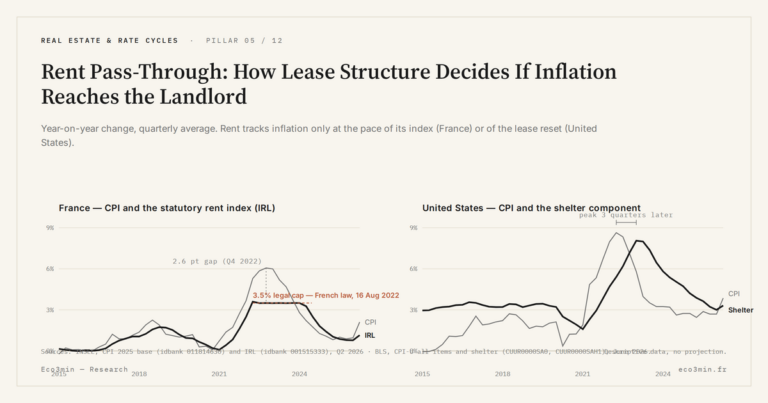
In parallel, cumulative eurozone inflation of 12–15% over 2022–2024 mechanically pushed rents higher, but in a limited way given existing controls (capped IRL rent index). The result: gross yields often remain too low to absorb the real cost of financing, especially in core large metropolitan areas.
Key mechanics: when leverage stops subsidizing rental real estate
Between 2015 and 2021, the dominant model was simple: near-zero rates, elevated prices but supported by cheap credit. A 3% gross yield was often sufficient, since debt cost was at or below that yield.
In 2026, the relationship remains stretched despite monetary easing:
- Average rental mortgage cost ≈3.3–3.5% over 20 years (market average, top profiles at ≈3.0–3.15% according to CAFPI and Meilleurtaux, February 2026);
- Gross yield on many tight-zone properties: 2.5–4%;
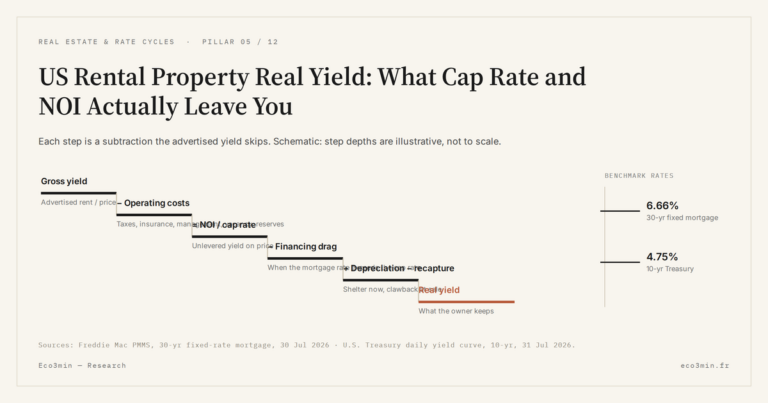
- Ancillary costs (non-recoverable charges, property tax, capex, mortgage insurance, property management): often 20–35% of rental income.
Put differently, on a €300,000 property let at €1,000 per month (gross yield ≈4%) financed at 90% LTV at 3.4%, net cash flow after charges and taxes remains frequently negative by €50 to €200 per month. That is admittedly better than the 4.2% rate of late 2023, but far from a self-funding model.
Part of the consensus expects a gradual return to more favorable conditions: continued rate cuts if inflation remains contained, price stabilization, and a quiet recovery in rental investment. The analysis here diverges on one central point: even if mortgage rates continue to drift lower, a durable return toward the 1–1.5% range of 2015–2021 is unlikely. The ECB Economic Bulletin (Issue 1/2026) notes that core inflation remains at 2.2% and that negotiated wages signal moderation rather than collapse. The performance driver will no longer be price appreciation amplified by debt, but the ability to generate positive cash flow in a structurally more expensive capital environment. Related analysis: Our study of property funds versus rental property.
This shift is not confined to rental real estate: it reflects a broader change in the housing regime, where prices respond less to headline rates than to the actual availability of credit. Our deep analysis of the mortgage credit cycle as a price driver shows why, in this new context, the contraction and partial normalization of financing first affects volumes and project selection, before showing up — often with a lag — in valuations.
This recomposition of the rental model fits within a broader reading of real estate as a cyclical asset class, heavily dependent on rate regimes, credit and macroeconomic dynamics. The reference page on real estate, rate cycles and the economy repositions the current trade-offs — buy, hold or sell — within these long-term cycles, helping to avoid a purely opportunistic analysis based solely on the spot price level.
Macro vs micro: why not all investors will see the same film
At the macro level, several forces shape the 2026 landscape:
- Moderate growth in the eurozone: GDP grew 1.5% in 2025 according to Eurostat (after 0.9% in 2024), supported by employment and defense/infrastructure spending. The ECB describes the economy as “resilient in a difficult global environment,” though growth remains uneven across countries.
- Contained inflation: 1.7% in January 2026 in the eurozone (below the 2% objective), which stabilizes rent indexations but no longer offsets the accumulated rise in charges between 2022 and 2024.
- End of free money, durably: 10-year French government bonds trade around 3.4%, setting a yield floor for institutional investors and maintaining pressure on credit costs. The spread to the German Bund remains a focus, fueled by French fiscal uncertainty.
At the micro level, reality diverges sharply across segments:
- Studios in city-center hyper-cores: still-high prices despite the correction, capped rents, gross yields often below 3%. Highly sensitive to taxation and DPE constraints.
- Well-located T2/T3 apartments in dynamic mid-sized cities: prices adjusted lower since 2023, relatively well-supported rents, possible gross yields of 4.5–6%. This is the segment where the rental spread can turn positive again.
- Outlying energy-intensive houses (DPE F-G): growing discount accentuated by the ban on letting class-G dwellings since January 2025, vacancy risk, heavy capex required. Apparent yields are misleading.
Notaires de France confirm this polarization: in their October 2025 review, the impact of the energy label on prices continues to widen, with an average gap of 16% between class-A and class-D dwellings of comparable characteristics.
This gradual but real shift creates a new fault line: no longer between “Paris vs Province” or “new vs existing,” but between rental real estate capable of generating a net yield above the total cost of capital… and the rest.
What readers really want to know: is this still the right time?
The real question is not whether prices will fall another 5–10%, but whether the risk taken today is rewarded. Behind the urge to “buy the dip,” many are actually trying to understand whether:
- the current entry point, after the 2025 stabilization, allows for cash flow at least near break-even;
- a back-up in long-end yields (if fiscal or geopolitical tensions intensify) could erase several years of rental income;
- it is preferable to wait for additional credit easing or to position now on highly targeted properties.
A reasonable reading: it is neither “too late” to exit insufficiently profitable rental real estate, nor “too early” to prepare acquisitions — provided one stays selective and accepts waiting for the right asset rather than the perfect timing.
3 plausible scenarios for 2026–2029
1. Extended plateau (the majority scenario)
Hypothesis: the ECB keeps policy rates around 2% in 2026 (the status-quo scenario confirmed on February 5, 2026), with a possible additional modest cut in H2 2026 if inflation stays below 2%. Mortgage rates oscillate between 3.0% and 3.5% over 20 years.
Possible consequences:
- Existing-home prices: nominal stabilization, real-term stagnation or slight decline (inflation-adjusted) over 3 years. Transaction volumes continue normalizing toward 950,000–1,000,000 per year.
- Rents: moderate increases of 1–2% per year on average, driven by IRL indexation and rental-market tightness in selected zones.
- Yields: gradual modest improvement, but no broad return of strongly positive cash flow.
2. Long-end rate back-up (risk scenario)
Hypothesis: persistent fiscal tensions in France (the 2026 budget, adopted with difficulty, fails to reassure markets), stickier-than-expected inflation, or a geopolitical shock pushing the 10-year OAT toward 4% and beyond.
Possible consequences:
- Mortgage rates durably above 3.5–4% — some analysts (Observatoire Crédit Logement) flag a risk of rates near 4% by end-2027;
- Sharper price correction (up to an additional 10–15% in some markets over 3 years);
- Highly leveraged investors come under stress, with forced trades and rising distressed sales.
3. Accelerated easing (less likely scenario, worth monitoring)
Hypothesis: confirmed disinflation below 2% (already underway at 1.7% in January 2026), the ECB resumes cuts in H2 2026, mortgage rates fall back toward 2.5–3%.
Possible consequences:
- Rebound in transaction volumes, return of buyer confidence;
- Rapid price stabilization, even partial recovery in dynamic, well-served zones;
- Yields compressed again, but partial leverage dynamics return for stronger profiles.
Markets are not pricing in full the possibility that long-end rates remain elevated despite low policy rates — a phenomenon tied to French sovereign risk and global geopolitical uncertainty. If this decoupling persists, low-yielding properties could continue to underperform, even amid monetary easing.
Common reading errors to avoid
- Focusing solely on gross yield: a 5% gross yield with €20,000 of hidden capex, an unrenovated DPE-F rating and a heavy tax burden can be less profitable than an optimized 4% gross. Correct approach: always shift to net yield, integrating predictable capex, taxes, insurance and energy-upgrade costs.
- Projecting 2010–2020 price gains onto 2030: that period was driven by near-zero rates, which is no longer the case — and the ECB consensus suggests it will not return. Correct approach: reason in scenarios of stable or slightly declining real prices, treating capital appreciation as a bonus rather than the business plan’s pillar.
- Confusing monetary easing with the return of free leverage: the ECB has indeed halved policy rates between 2024 and 2025, but mortgage rates remain 2 to 2.5 points above their 2021 floor. Bank spreads and long-end refinancing costs prevent a quick return to pre-cycle conditions.
- Ignoring illiquidity: assuming one can always resell within 3 months “at the right price” is misleading if volumes remain 25–30% below 2021 levels. Correct approach: factor in a 10–15-year horizon, and the possibility of having to sell at a discount to exit quickly.
Concrete benchmarks to evaluate a rental project
1. Allocation framework to consider
For a diversified financial portfolio in 2026, the following analytical reference frames have been observed:
- Conservative profile: 0–10% in direct rental real estate, potentially complemented by 10–20% in more liquid real-estate vehicles (SCPI, listed property companies) depending on risk profile.
- Balanced profile: 10–20% in direct rental, 10–15% in diversified real-estate vehicles.
- Aggressive profile with high debt capacity: up to 30% in direct rental, accepting a long horizon and stress scenarios (vacancy, rising charges, energy-renovation capex).
2. KPI to track: the “rental spread”
One useful indicator: comparing the project’s net rental yield to the full cost of capital (mortgage rate plus the opportunity cost of immobilized down payment, e.g. the return it would have generated on a 2.5–3.5% vehicle).
Simple method:
- Compute net yield (after non-recoverable charges and taxes): annual net rents / total price (fees included).
- Compare it to: mortgage rate + 1–2 points to remunerate the down payment.
If net yield is lower than or barely equal to this cost, the project rests largely on the hope of future capital gains: risk becomes asymmetric.
3. Entry/exit signals to monitor
- Entry pattern: zone where prices have corrected at least 10–15% from peak, rents continue to rise, vacancy rates remain low, and the property meets DPE standards (C or better). At that point, if the rental spread turns positive by 2 points above cost of capital, the file becomes interesting.
- Caution pattern: durably negative cash flow despite charge optimization, the need to inject savings each month, and prospect of heavy capex (DPE upgrades): historically a signal to reweight part of the portfolio.
- Exit pattern: if the market value remains 20–30% above the price at which the same property could be repurchased today, while generating little or no cash flow, sale becomes rational — especially as recovering transaction volumes open a window of liquidity.
Reverse risk: what could invalidate this reading
Several factors could change the picture:
- Faster-than-expected monetary easing: if inflation continues to fall below 2% and the ECB resumes cuts in H2 2026, mortgage rates could drift back toward 2.5–3%, restoring some value to leverage. According to the ECB Economic Bulletin (February 2026), current data do not exclude this, although the central scenario remains the status quo.
- Targeted housing fiscal stimulus: the 2026 budget, adopted with difficulty, includes selected measures (extended MaPrimeRénov’, targeted schemes). A supply shock or reinforced fiscal incentives could shift the price-rent balance.
- Unexpected demand shock: migration flows, work reconfiguration (stabilized remote work redefines geographic demand), or euro appreciation (above $1.20 at end-January 2026) potentially attracting foreign investors to certain segments.
In those cases, currently unattractive assets could recover faster than expected. Conversely, “safe haven” markets could underperform if demand shifts elsewhere.
Implications for three reader profiles
Financial investors: the key message is not to flee rental real estate, but to treat it as an illiquid sleeve with a high required return. Within a diversified portfolio, transactions where net yield exceeds cost of capital by at least 2 points are those that warrant attention. The two-point cushion of net yield over the cost of capital is the exact yardstick of the gap between net rental yield and the cost of capital. Beyond 20–30% global exposure to direct real estate, concentration and illiquidity risks rise disproportionately.
Companies (SMEs, professional services): the case for buying business premises depends on the real cost of financing. At 3.3–3.5% rates and with prices that have not yet fully adjusted in some segments, remaining a tenant and placing capital in more liquid vehicles can be more rational, at least until the adjustment is more advanced.
Individuals: for a first rental investment, smaller properties in zones with resilient rental demand, targeting near-break-even cash flow from the outset, have been the more frequent observed approach. Integrating DPE upgrade costs into the budget. A modest but sustainable project tends to outperform an “ambitious” one that turns monthly savings into a permanent infusion.
Several trajectories remain open for rental real estate through 2030. The ECB deposit-rate path from 4% to 2% between 2024 and 2025 has loosened the vise, but the persistent gap between policy rates and credit rates shows that financing normalization is a slow, incomplete process. The risk is less visible than others — and therefore easier to ignore: overpaying for a low-yielding asset in the hope of a return to the previous world. That is precisely the bet the most lucid investors gain from avoiding. On the same theme: our note on how credit and volumes drive property prices.
Frequently asked questions on rental real estate in 2026
Mortgage rates have fallen since the 2023 peak: is it enough to revive rental investment?
The decline is real (from above 4% to ≈3.3% over 20 years), but the level remains well above the 1–1.5% that supported the rental model before 2022. A project can be relevant if net yield clearly exceeds cost of capital and if the local rental market shows solid demand. That is where what higher rates changed in the rental-investment case comes in. “Marginal” files that worked at 1% rates remain too risky at 3.3%. In the same vein: how REIT total return differs from yield.
The ECB has brought rates back to 2%: why does mortgage credit remain so expensive?
Mortgage rates depend less on policy rates than on the 10-year OAT (≈3.4% in early 2026), which reflects banks’ long-term refinancing cost. French fiscal uncertainty and global geopolitical tensions hold this benchmark at elevated levels, creating an unusual gap between short and long rates.
Is it better to repay an old 1.5% rental mortgage or keep the leverage?
If the loan rate is materially below current risk-free yields (2.5–3%), keeping cheap leverage often remains rational. Early repayment makes sense mainly when one is overexposed to real estate or when the property generates durably negative cash flow with no improvement prospect.
Have small cities become more attractive than major metropolitan areas?
Not automatically. Some mid-sized cities with diversified employment, real rental tightness and already-corrected prices offer interesting yields. Others, dependent on a single employer or in demographic decline, remain risky. Analysis must remain highly localized — especially as the general 2025 price stabilization masks substantial regional dispersion.
How should vacancy risk be integrated into yield calculations?
A prudent approach is to embed one month of vacancy per year in the business plan from the outset (i.e. ≈8% lower rental income) and stress-test profitability with two months to assess the safety margin. If the project does not hold up under this assumption, it is too tight.
What is the DPE impact on rental yields in 2026?
Since January 2025, class-G dwellings are banned from letting. Class-F dwellings will be banned starting 2028. According to Notaires de France (October 2025 brief), the price gap between class-A and class-D dwellings reaches 16%, all else equal. Integrating energy-upgrade costs is now indispensable in any yield calculation, on pain of overstating the project’s real profitability.
3 takeaways
- In 2026, rental real estate remains a cash-flow game, not a capital-gains game: despite monetary easing, credit costs are still high enough that an insufficient net yield turns an investment into a net cost.
- The real differentiation runs between a few well-located, DPE-compliant, properly priced assets, and a mass of mediocre properties that the new rate regime brings back to reality — with energy constraints as an aggravating factor.
- Rather than chasing the “right time,” the more lucid investors target the right asset, in the right local market, with a positive rental spread and a horizon of at least 10 years.
Last updated — 25 July 2026
Disclaimer – Financial Information: The analyses, commentary, and content published on eco3min.fr are provided for informational and educational purposes only. They do not constitute investment advice or a solicitation to buy or sell financial instruments. Past performance is not indicative of future results. All investment decisions involve risk and are the sole responsibility of the reader.
Read next
Full pillar →US Rental Property Real Yield: What Cap Rate and NOI Actually Leave You
A rental listing leads with a yield. Divide the annual rent by the price and the number looks…
Cap Rate Spread: What Rental Yield Pays Over the 10-Year Treasury
A 5% cap rate sounds attractive. But 5% against what? A risk-free 10-year Treasury yields near 4.5% in…
US Rental NOI, Line by Line: What Net Operating Income Really Subtracts
A US rental yield is advertised gross: annual rent over price. Between that number and the income an…