
Household Income Percentile by Age of Householder
Where a household income ranks within each age group of householder in the US. Census medians for 2025 run from $60,870 under 25 to $120,100 at 45 to 54.
Median household income in 2025 peaked for householders aged 45 to 54 and was lower at both ends of the age range. Each group has its own distribution, so one income can sit in the top quarter of one and below the median of another.
This page ranks an income within each of six age groups, from Census Bureau data on 2025 incomes, and shows why a national percentile blends them together.
In 2025, a $100,000 household income ranked at the 75th percentile among households headed by someone under 25, the 42nd at 45 to 54 and the 55th overall.
- The ranks are Eco3min estimates from Census Bureau microdata on 2025 incomes, collected in the 2026 CPS ASEC. The Census Bureau’s own medians rise from $60,870 under 25 to $120,100 at 45 to 54, then drop to $59,680 from 65 (table H-10).
- The national median, $87,460, is lower than the median of every age group from 25 to 64. Households headed by someone 65 or older, the group with the lowest median, make up 30.6% of the total, against 19.4% in 1967.
- Keeping each age group’s 2025 incomes but giving the groups their 1967 shares of households, the 2025 median would be about 5.5% higher (Eco3min calculation).
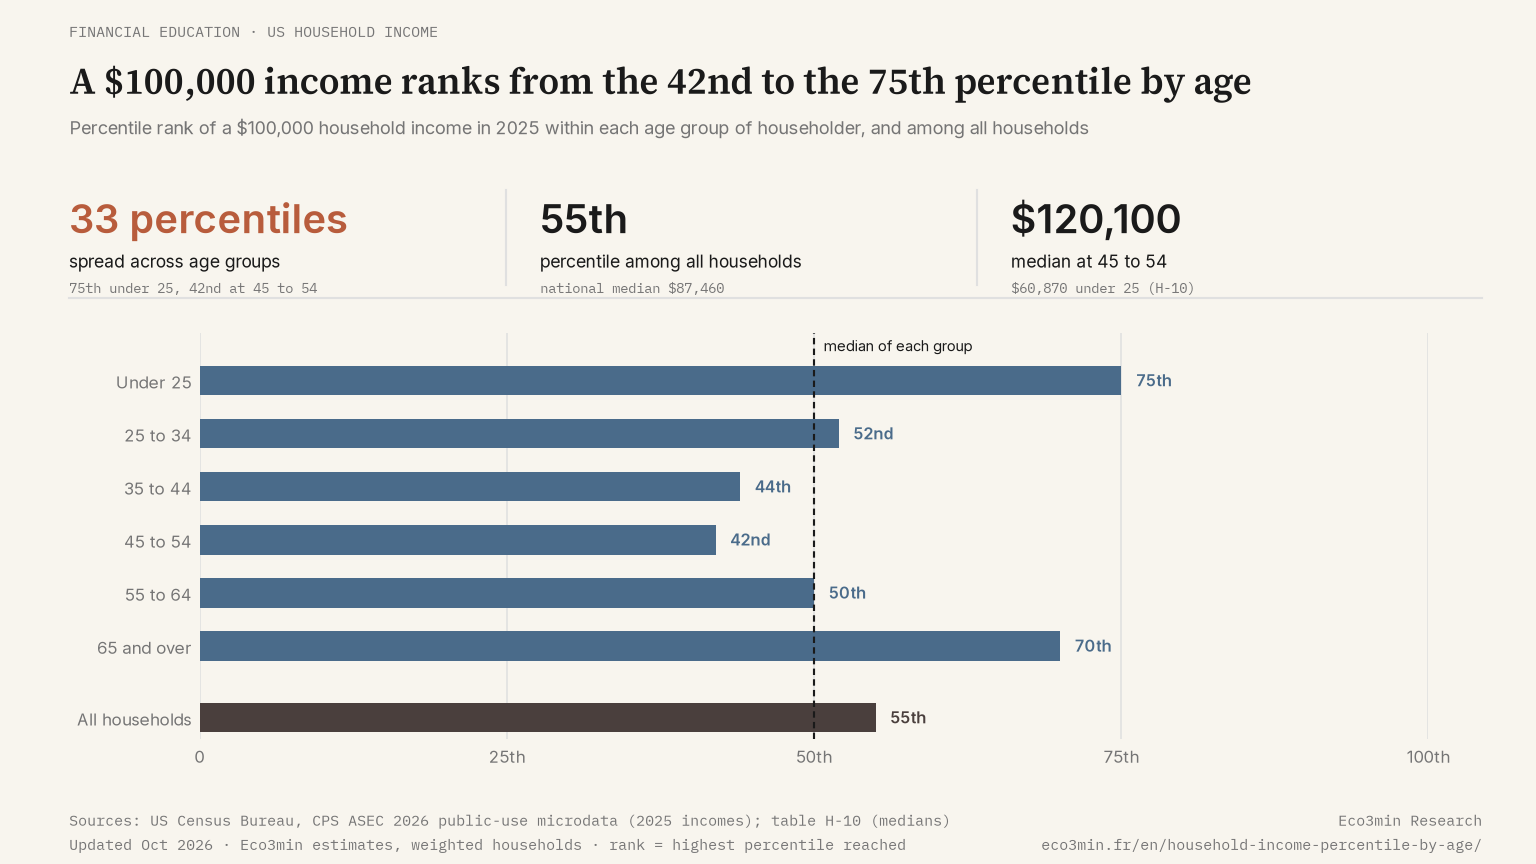
A national percentile pools every household in one ranking, so a household headed by a 24-year-old sits in the same list as one headed by a 50-year-old. Ranked among households of the same age instead, an income of $100,000 moves by 33 percentiles from one age group to another. The table below sets out the six groups, with the Census medians alongside the Eco3min estimates.
Six age groups, six distributions
| Age of householder | Median (Census H-10) | 25th percentile (Eco3min) | 75th percentile (Eco3min) | 90th percentile (Eco3min) | Rank of $100,000 (Eco3min) |
|---|---|---|---|---|---|
| Under 25 | $60,870 | $34,000 | $100,000 | $155,000 | 75th |
| 25 to 34 | $94,880 | $54,000 | $151,000 | $226,000 | 52nd |
| 35 to 44 | $114,100 | $61,000 | $191,000 | $304,000 | 44th |
| 45 to 54 | $120,100 | $62,000 | $208,000 | $325,000 | 42nd |
| 55 to 64 | $99,320 | $48,000 | $178,000 | $287,000 | 50th |
| 65 and over | $59,680 | $29,000 | $113,000 | $200,000 | 70th |
The gap between groups is wide. The median for householders aged 45 to 54, $120,100, is almost twice the under-25 median of $60,870. From 65 it is $59,680, half the 45 to 54 level. The national median of $87,460 sits at the 36th percentile of the 45 to 54 group and the 68th of the under-25 group.
Past 25, the spread widens with age. On the rounded values of the table, the 90th percentile is 4.2 times the 25th at 25 to 34, 5.2 times at 45 to 54 and 6.9 times from 65. Under 25 the ratio is 4.6, wider than at 25 to 34. Where the top tenth of all households begins is set out in income thresholds of the top 10%.
Households under 25 and those 65 and over have almost the same median, $60,870 and $59,680. The shapes differ. The older group has a lower 25th percentile ($29,000 against $34,000) and a higher 90th ($200,000 against $155,000). In 64.3% of those older households nobody had earnings in 2025, while the other 35.7% had at least one earner. Earnings made up 33.0% of the group’s total income, against 87.4% under 25, and the rest came from Social Security, pensions and other retirement income, interest, dividends and other sources (Eco3min tabulation of the same microdata). That mix of working and retired households is one plausible source of the wider spread.
Rank an income within each age group
Enter a household’s total income for a year, before taxes. The calculator places it within each of the six age groups at once and among all US households, with each group’s Census median as a marker. Above the 95th percentile of a group it shows only “top 5% of the age group”, for the reasons given in the method below.
Reading the table as the path a household will follow. Each row describes different households in the same year, so the $120,100 median at 45 to 54 reflects people born mostly in the 1970s, with their own education, careers and household make-up. The table ranks a household against others of the same age in 2025, which is the comparison the calculator makes.
Why the national median sits below most age groups
Two groups pull the national median down, those at either end of the age range. Households headed by someone under 25 are few, 4.0% of the total. Those headed by someone 65 or older are many, 41.9 million in 2025, or 30.6% of all households against 19.4% in 1967 (Census table H-10).
The aging of households is one reason the overall median grew less than most age groups. Between 1967 and 2025 the real median rose 55.5% for all households. It rose less in the two youngest groups, 37.7% under 25 and 50.4% at 25 to 34, and more in every other, from 61.1% at 35 to 44 to 174.6% from 65. Reweighting gives the size of the age effect. With the 1967 age mix and each group’s 2025 incomes, the 2025 median would be about 5.5% higher, an Eco3min calculation that leaves out every other change in household make-up. How each point of the distribution moved over the same decades is traced in income growth across the distribution.
A national ranking answers a different question, where a household stands among all households whatever their age. Year-by-year ranks on that scale are in national household income percentiles.
How the ranks were estimated
The source is the Census Bureau’s public-use microdata for the 2026 Annual Social and Economic Supplement of the Current Population Survey (CPS ASEC), which records 2025 incomes. Each household is classed by the age of its householder, the person in whose name the home is owned or rented, and weighted with the household supplement weight. For each age group, and for all households together, Eco3min computes the 1st to 95th weighted percentiles of household money income before taxes. An income’s rank is the highest percentile it equals or exceeds. A rank of 75 means the income is at or above that of three households in four in the group.
The file holds 53,344 households, 1,777 of them with a householder under 25 and 16,604 from 65. Under simple random sampling, the 95% margin on a rank near the median would be about 2.3 percentiles under 25 and 0.8 from 65. The survey’s multistage design usually widens both, so ranks under 25, the 75th for $100,000 included, are the least precise in the table.
Against the medians the Census publishes in table H-10, the microdata medians fall short in all six groups, by 0.1% to 0.8%. The Census computes its medians on its internal file. The percentiles here are incomes as reported in the public file, taken as they are. The gap does not move a rank. Each published median falls at the 50th percentile of its group in the microdata.
Above the 95th percentile of a group, the page gives no rank. To protect respondents, the public file swaps the largest income amounts between high-income records and rounds them, so finer ranks in the top 5% would mostly reflect those changes.
What an age-group rank leaves out
The rank compares household incomes whatever the number of people they support. Households headed by someone 35 to 44 average 3.2 people, those headed by someone 65 or older 1.8, so the same income stretches further in the second. Adjusting for size is the method behind middle income thresholds by household size. The householder’s age also classes everyone under one roof: when an adult child lives with parents, all their incomes count in the parents’ age group.
Money income leaves out wealth. An older household with a paid-off home and savings can rank low on income alone. How income, assets and debt pull against each other is the thread of everyday money decisions and the cycle.
One year, one survey. The ranks describe 2025 and will be recomputed when the Census publishes 2026 incomes.
Last updated — 1 October 2026
Disclaimer – Financial and Legal Information: The analyses, commentary, and content published on eco3min.fr are provided for informational and educational purposes only. They do not constitute investment advice or a solicitation to buy or sell financial instruments. Past performance is not indicative of future results. All investment decisions involve risk and are the sole responsibility of the reader. Data, charts and calculated series are provided as is and may contain errors or lag behind their source: check any figure against the primary source cited before relying on it. Content describing laws, regulations or contracts reflects the law as of its publication date and does not constitute legal or tax advice; applying it to a specific situation requires a qualified legal or tax professional.
Regulated and tax values: the rates, indices, caps and brackets with legal effect cited on this page are set by official decision, change over time and apply according to individual circumstances. Only the official publication in force on the relevant date is authoritative (for example the Journal officiel, INSEE, Banque de France, the IRS or the Social Security Administration). To revise a rent, sign or challenge a contract, or file a return, check the value at the source or with a professional.