
How are American homes heated? Main heating fuel, 1940 to 2025
How US homes are heated
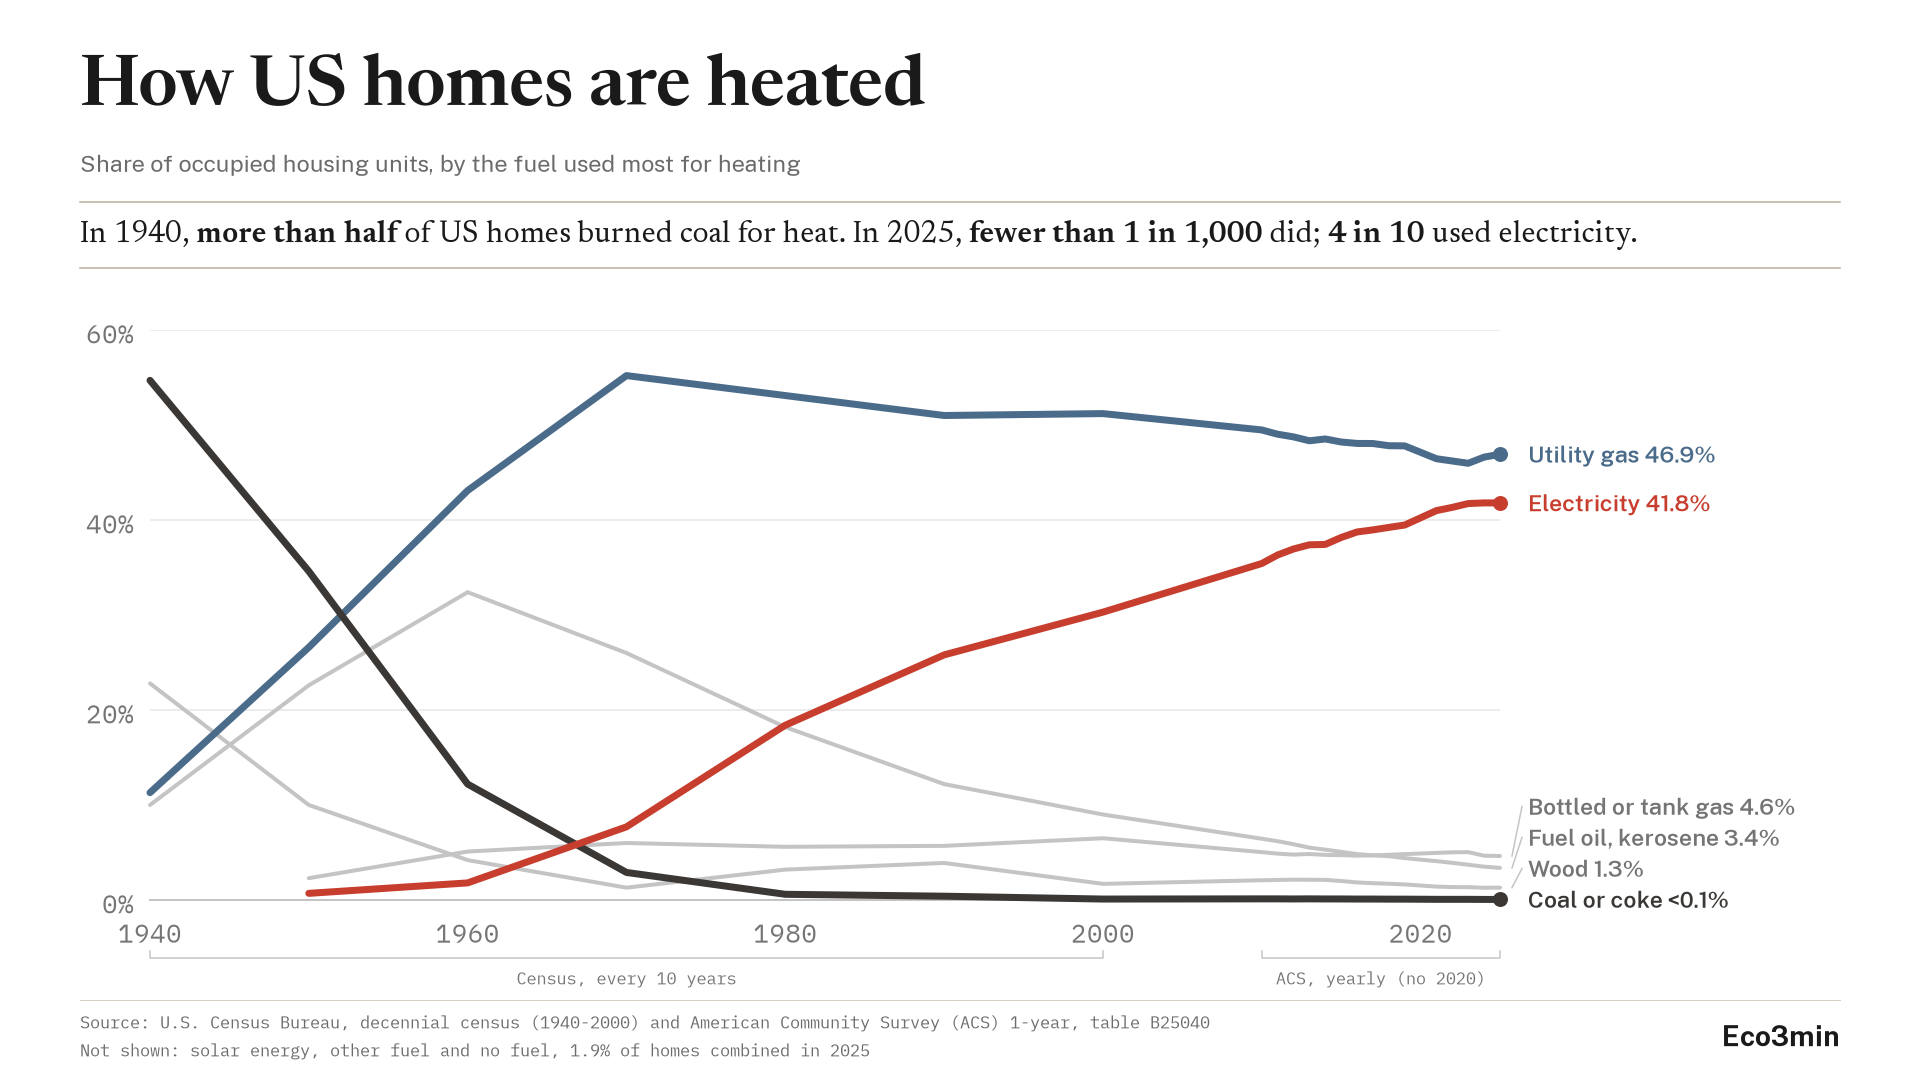
Share of occupied housing units, by the fuel used most for heating. Census 1940-2000, American Community Survey 2010-2025.
The fuel each home uses most for heating, not its equipment: electricity does not separate heat pumps from resistance heating. Census every ten years to 2000, then the ACS every year; lines join the published points.
Download the data (CSV, 1940-2025)
TL;DR. In 2025, utility gas was the main heating fuel of 46.9% of occupied US homes and electricity of 41.8%, according to the Census Bureau’s American Community Survey.
- In 1940, coal heated 54.7% of the homes that reported a heating fuel. In 2025 it heated 0.06%, about 79,000 homes.
- Electricity rose at every census from 0.7% in 1950, and went from 35.4% in 2010 to 41.8% in 2025 in the ACS. Gas has been the first fuel at every point since 1960 and peaked at 55.2% in 1970.
- Gas led electricity by 47.5 points in 1970, 14.1 in 2010 and 5.1 in 2025, with the gas answers reworded since the 2024 questionnaire.
Most American homes are heated with utility gas, the natural gas piped to the neighborhood: 46.9% of occupied housing units in 2025, about 63 million homes. Electricity heats 41.8%, about 56 million, out of 134.1 million occupied homes, according to the U.S. Census Bureau’s American Community Survey (ACS). Bottled or tank gas, such as propane, is the main fuel of 4.6% of homes, fuel oil of 3.4%, wood of 1.3% and coal of 0.06%.
The chart above follows these fuels from the 1940 census to the 2025 ACS. The first view draws six fuels, two of them from 1950. The second stacks the full mix to 100% of occupied homes. The third zooms in on the ACS years since 2010, with the 90% margin of error of each estimate in the tooltip. The data behind them, one row per census or survey year, can be downloaded from the CSV link under the chart.
Key figures at a glance
Scope: main heating fuel of occupied US housing units, share of homes, decennial census 1940 to 2000, ACS 1-year estimates 2010 to 2025 (no 2020)
2025: utility gas 46.9% (margin of error ±0.10 point), electricity 41.8% (±0.08), bottled or tank gas 4.6%, fuel oil 3.4%, wood 1.3%, coal 0.06%
1940: coal 54.7%, wood 22.8%, utility gas 11.3%, fuel oil 10.0%
Peaks: utility gas 55.2% (1970), fuel oil 32.4% (1960)
Gas minus electricity: 47.5 points (1970), 14.1 (2010), 5.1 (2025)
Sources: U.S. Census Bureau, decennial census time-series tables on house heating fuel and American Community Survey 1-year estimates, table B25040, House Heating Fuel, fetched 30 October 2026. Eco3min calculation of the ACS shares and margins.
What the census counts
The question asks which fuel is used most for heating the house, apartment or mobile home. Each home gives one answer: a house with a gas furnace and a wood stove counts once, under the fuel it uses most. The answer names a fuel, not a heating system, so the electricity category does not separate heat pumps from electric resistance heating.
Two surveys carry the series. From 1940 to 2000, the decennial census asked it of a sample of homes, and the Census Bureau publishes the national shares in its time-series tables. The American Community Survey, which replaced the census long form, publishes yearly estimates. This file uses its one-year estimates from 2010, the first vintage that data.census.gov serves, so it has no point between 2001 and 2009.
The answers are 9: utility gas; bottled, tank or LP gas; electricity; fuel oil or kerosene; coal or coke; wood; solar energy; other fuel; and no fuel used. The dataset keeps all of them. In 1940, the census table gives no separate figures for bottled gas and electricity, so both lines start in 1950.
Coal gave way to gas between two censuses
In 1940, 54.7% of the homes that reported a heating fuel burned coal, 22.8% wood, 11.3% utility gas and 10.0% fuel oil. Ten years later, coal was down to 34.6% and gas up to 26.6%, already ahead of wood. Gas moved ahead of coal between the 1950 and 1960 censuses: by 1960 it heated 43.1% of homes and coal 12.2%.
Utility gas peaked at 55.2% in 1970, the highest share any fuel reaches in the file. It has been the first heating fuel at every point since 1960, and stood at 46.9% in 2025. The price side is followed in our natural gas price history dataset.
Fuel oil took another path. It rose from 10.0% in 1940 to 32.4% in 1960, its peak, then fell at every census and every ACS year: 26.0% in 1970, 18.2% in 1980, 9.0% in 2000 and 3.4% in 2025, about 4.5 million homes. The price of heating oil at New York Harbor since 1986 is in our heating oil spot price dataset.
Coal fell to 2.9% in 1970 and 0.6% in 1980. Wood went from 22.8% in 1940 to 1.3% in 1970, rose to 3.9% in 1990 and was back at 1.3% in 2025. Bottled, tank or LP gas has stayed between 4.6% and 6.5% of homes at every point since 1960; Mont Belvieu propane prices since 1992 are in our propane spot price dataset.
Electricity: up at every census since 1950
Electricity first appears in the census table in 1950, at 0.7%. It has risen at every census since: 1.8% in 1960, 7.7% in 1970, 18.4% in 1980, 25.8% in 1990 and 30.3% in 2000. In the ACS, it went from 35.4% in 2010 to 41.8% in 2025. The share, computed to two decimals, rose each year to 2024 and stood at 41.80% in both 2024 and 2025, and some yearly steps are smaller than the 90% margin of error.
It moved ahead of coal between the 1960 and 1970 censuses, and by 1980 it had caught up with fuel oil (18.4% against 18.2%). In 2025, about 56 million homes were heated mainly with electricity. The category covers every electric system: the ACS does not separate heat pumps from electric resistance heating, so the series cannot say how much of the rise comes from either. Residential power prices are in our US residential electricity price dataset.
Gas and electricity since 2010
In 1970, utility gas led electricity by 47.5 points. In 2010, the first ACS year of the file, the lead was 14.1 points (49.5% against 35.4%). In 2025, it was 5.1 points. Each ACS share is an estimate: in 2025, the 90% margin of error is 0.10 point for utility gas and 0.08 point for electricity.
The 2024 figure came with a change on the form. From the 2024 ACS, the two gas answers read “Natural gas from underground pipes serving the neighborhood” and “Bottled or tank (propane, butane, etc.)”, against “from underground pipes serving the neighborhood” and “bottled, tank, or LP” on the 2023 form. The Census Bureau made the change after cognitive testing, so that respondents pick the right gas category, and its 2024 subject definitions state that 2024 heating fuel data can be compared with earlier ACS data. The 2025 questionnaire keeps the same wording.
Between 2023 and 2024, the utility gas share rose 0.65 point and the bottled gas share fell 0.38 point. Both moves coincide with the rewording, and this page draws no trend from them. Between 2024 and 2025, with the same wording, utility gas rose 0.30 point, more than the 0.13-point margin of error of the change, while electricity stayed at 41.8%.
What the series leaves out
Equipment. The census records the fuel, not the furnace, boiler or heat pump that burns or converts it. Heating equipment is the subject of another survey, the Residential Energy Consumption Survey of the U.S. Energy Information Administration.
Second fuels. A home that burns wood on cold evenings but heats mostly with gas counts as a gas home. Regions, too: the file holds the national row only, and the ACS publishes table B25040 for states and smaller areas as well. The series breaks between 2000 and 2010, when it moves from one survey to another, and has no 2020 point: the Census Bureau released only experimental one-year estimates for that year, after the pandemic disrupted data collection.
Two ways to read the same lines
One reading follows electricity. Up at every census since 1950, it went from 35.4% to 41.8% of homes between 2010 and 2025, and the gap with gas went from 14.1 to 5.1 points over the same years.
The other reading follows gas. It has been the first fuel at every point since 1960 and still heats about 63 million homes. Its 2024 move coincides with a reworded question, and it rose again in 2025 with the same wording. The census measures the fuel, not the equipment or the reasons behind a choice. The data hold both readings and do not say whether, or when, the order of the two changes.
Methodology and sources
Series. U.S. Census Bureau, house heating fuel, United States.
- 1940 to 2000: decennial census time-series tables coh-fuels (one file per census), United States row, shares as published.
- 2010 to 2025: American Community Survey 1-year estimates, table B25040, counts and margins of error, fetched from data.census.gov on 30 October 2026.
Construction. ACS share = homes using the fuel / all occupied housing units, from the published counts. The 90% margin of error of each share follows the Census Bureau’s formula for a proportion. The decennial shares are taken as published, with no margin of error in the file.
Universe. Occupied housing units. In 1940 and 1950, the census tables give shares of the occupied units that reported a heating fuel. Even if every 1940 home that reported none had used something other than coal, coal would still account for 53.2% of occupied homes (Eco3min calculation from the census counts).
Missing values. 1940: bottled gas and electricity, not tabulated separately (NA at source); the categories shown sum to 100%. 2001 to 2009: not in the file (ACS 2005-2009 one-year vintages are not served by data.census.gov). 2020: no standard ACS 1-year release. The CSV leaves these cells empty; nothing is interpolated.
Set. Every house heating fuel category the Census Bureau tabulates, 9 in the ACS. The chart draws six; solar energy, other fuel and no fuel used, 1.9% of homes combined in 2025, are in the full-mix view and the CSV.
Limitations. (1) Fuel, not equipment: heat pumps cannot be separated. (2) One answer per home: second fuels are not counted. (3) National row only. (4) Two surveys: the series breaks between 2000 and 2010, and the 2024 form reworded both gas answers.
Reproducibility. The CSV below is built by script from the Census files and the Census API; no value is typed in. The chart is produced with Python (matplotlib), the interactive version in plain SVG.
Common misinterpretations
Reading electricity as heat pumps. The census category is a fuel. It counts heat pumps and electric resistance heating together, and the ACS gives no split between them.
Reading 2000 to 2010 as one survey. The decennial census and the ACS are two surveys with different designs. Both record the fuel used most for heating, but a move across the break mixes a change in homes with a change in survey.
Reading the 2024 gas move as a trend. It coincides with a reworded question. The move is 0.65 point; the gap with electricity was 47.5 points in 1970 and 14.1 in 2010.
Frequently asked questions
How are most American homes heated?
With utility gas: 46.9% of occupied housing units in 2025, about 63 million homes, according to the American Community Survey. Electricity comes second, at 41.8%, about 56 million.
What percentage of US homes are heated by natural gas?
46.9% of occupied homes used utility gas, natural gas from underground pipes, as their main heating fuel in 2025. Bottled or tank gas, such as propane, is a separate category, at 4.6%.
What percentage of US homes have electric heat?
41.8% in 2025, about 56 million occupied homes, against 0.7% in 1950. The figure covers heat pumps and electric resistance heating together.
How many homes use heating oil?
About 4.5 million US homes, 3.4% of occupied housing units, used fuel oil or kerosene as their main heating fuel in 2025. The share peaked at 32.4% in 1960.
Do American homes still heat with coal?
Fewer than 1 in 1,000: 0.06% of occupied housing units in 2025, about 79,000 homes. In 1940, coal heated 54.7% of the homes that reported a heating fuel.
Why is there no 2020 point?
The Census Bureau released no standard ACS 1-year estimates for 2020, only experimental ones, because the pandemic disrupted data collection.
Download the complete dataset
One CSV file: one row per census or survey year (1940 to 2000 every 10 years, 2010 to 2025 every year, 2020 empty), the share of each of the 9 heating fuel categories, the ACS counts and 90% margins of error, and the gap between gas and electricity.
Source: U.S. Census Bureau, decennial census and American Community Survey.
Conclusion
Coal was the first heating fuel of US homes at the 1940 and 1950 censuses, utility gas at every point since 1960. Electricity, not tabulated separately in the 1940 table, gained at every census from 1950 to 2000 and heats 41.8% of homes, 5.1 points behind gas in 2025. Over the 85 years of the file, fuel oil rose and fell, and coal went from more than half of homes to fewer than 1 in 1,000.
The 2026 ACS one-year estimates, not yet scheduled by the Census Bureau as of 30 October 2026, will add the next point.
Last updated — 30 October 2026
Disclaimer – Financial and Legal Information: The analyses, commentary, and content published on eco3min.fr are provided for informational and educational purposes only. They do not constitute investment advice or a solicitation to buy or sell financial instruments. Past performance is not indicative of future results. All investment decisions involve risk and are the sole responsibility of the reader. Data, charts and calculated series are provided as is and may contain errors or lag behind their source: check any figure against the primary source cited before relying on it. Content describing laws, regulations or contracts reflects the law as of its publication date and does not constitute legal or tax advice; applying it to a specific situation requires a qualified legal or tax professional.