
The Iron Ore Market: Steel Demand, the Big Four and the 62% Fe Benchmark

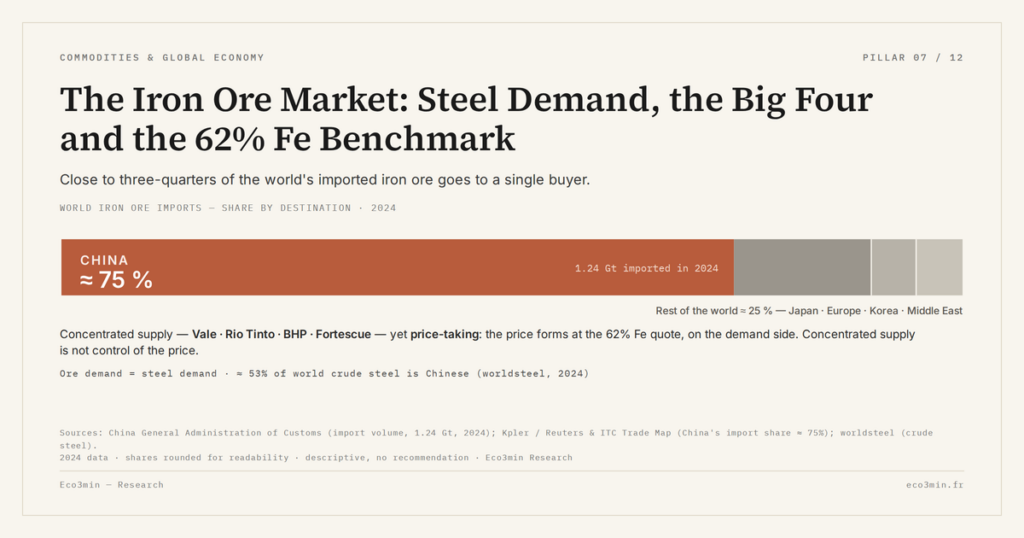
The iron ore market comes down to a handful of structural facts: a physical good carried by sea, four dominant producers, a 62% iron reference price, and a single buyer that all but decides demand. Grasp them, and any quote becomes readable.
TL;DR
Four producers (Vale, Rio Tinto, BHP and Fortescue) ship most seaborne ore, yet the price forms at the quote, where the Chinese buyer outweighs any single one of them.
- The 62% Fe grade anchors the reference price, tracked by the IMF's Primary Commodity Prices series through the St Louis Fed's FRED database, between the 65% grade at a premium and the 58% at a discount.
- Despite sitting at the bottom of the cost curve, the Big Four hold their volumes when prices fall while higher-cost Chinese and non-major mines idle first, leaving a market slow to clear and asymmetric on the downside.
Before iron ore can be read as a signal, its market has to be understood: who produces, who buys, how the price forms. This groundwork underpins every macroeconomic reading that follows.
A physical market dominated by sea freight
Iron ore is first of all a heavy physical good, mined, crushed, beneficiated, then shipped in bulk. Its logistics split into two distinct worlds. The first is the domestic market: each major steelmaking country works its own deposits, often low-grade and costly. The second, the one that sets the world price, is the seaborne market, where rich ore from Australia and Brazil crosses the oceans to Asian mills. It is this maritime flow that forms the reference quote, because it represents the freely tradable ore, as opposed to domestic ore captured within integrated supply chains.
The economics of this split explain the price hierarchy. Australian and Brazilian seaborne ore carries high iron content and some of the lowest production costs in the world, the fruit of rich deposits worked at scale. Chinese domestic ore, by contrast, is low-grade — often far less concentrated in iron — and expensive to mine and beneficiate. That asymmetry makes Chinese ore a swing supply: it is worked when the world price rises enough to cover its costs and mothballed when it falls. This is why the seaborne benchmark, not domestic output, sets the marginal price: the tonne that clears the market is almost always an imported one.
The destination of that flow is nearly singular. Close to 98% of the iron ore produced worldwide goes into making steel; there is virtually no other meaningful end-use. This single destination makes the ore market inseparable from the steel market: iron ore demand is nothing but steel demand, shifted one step upstream. Understanding the market therefore means immediately tracing back to what steel serves, and who makes it. This purity of end-use is also what makes ore such a legible indicator — a point developed in our study of iron ore as a Chinese construction signal.
What the ore serves: steel demand
World steel demand is dominated by a single geography. China produces more than half of global crude steel: 960.8 million tonnes in 2025 out of a world total of 1,849.4 million, or 52%, after 1,005.1 million out of 1,882.6 in 2024 (World Steel Association, January 2026). No other economy comes close, with India in second place at 164.9 million tonnes. On the ore side, China imported 1.24 billion tonnes in 2024 (Chinese customs), close to three quarters of world imports. And Chinese output goes mostly into construction: property has long accounted for something like a third of the country’s steel demand, infrastructure a comparable share, the rest spread across machinery, autos, durable goods and exports.
This Chinese dominance is recent on the scale of industrial history. At the turn of the 2000s, China accounted for roughly a seventh of world steel. Its accession to the World Trade Organization in 2001, followed by two decades of urbanization and infrastructure investment, lifted its share past half. The iron ore market reconfigured around that demand: the major producers built capacity sized for continuous Chinese growth, and the reference price left the annual-contract regime for market pricing. The market’s current structure — abundant supply, concentrated demand — is the direct inheritance of that shift.
The Big Four and the structure of supply
On the supply side, the seaborne market is exceptionally concentrated. Four producers dominate most of the tonnage exported by sea: Vale, in Brazil, and three Australia-anchored groups, Rio Tinto, BHP and Fortescue. These “Big Four” work rich, low-cost deposits served by dedicated ports and rail lines built during the two decades of sustained Chinese demand. Their position at the bottom of the cost curve gives them a particular place: they produce the cheapest tonnes, while higher-cost Chinese domestic ore and non-major producers act as swing supply.
This low-cost position gives the majors resilience rather than pricing power. Because they sit at the bottom of the cost curve, they can keep producing profitably even when the price falls to levels that force higher-cost domestic mines to idle. That is why a price decline tends to squeeze the marginal Chinese and non-major producers first, while the Big Four hold their volumes. The result is a market slow to clear on the downside and asymmetric in its adjustment — but it is the demand side, not producer coordination, that ultimately sets the level.
This concentration does not, however, make the Big Four masters of the price. Iron ore is not a market administered by its producers; it is a demand market, where the price forms at the quote and the Chinese buyer carries its full weight. The majors influence the balance through their volume decisions, but they remain largely price-takers. The detail of that cost curve, of the marginal producer and of the supply shocks ahead — foremost among them the Simandou deposit in Guinea — is the subject of a dedicated analysis of the producers’ cost curve.
The 62% Fe benchmark: how the price forms
The reference price applies to a specific grade: ore with 62% iron content, quoted in dollars per tonne. This benchmark is tracked monthly by the International Monetary Fund’s Primary Commodity Prices series, accessible through the St Louis Federal Reserve’s FRED database. The choice of 62% reflects its liquidity: it is the most traded grade, between the 65% high grade that trades at a premium and the 58% low grade that takes a discount. Content matters because richer ore yields more steel per tonne and cuts coke consumption in the blast furnace.
The spread between grades carries its own information. When Chinese mills run flat out and seek to maximize blast-furnace productivity while limiting emissions, they favour high-grade ore, and the premium of 65% over the 62% benchmark widens. When margins tighten, that premium compresses as mills fall back on cheaper ore. The grade differential thus offers a secondary read on the health of Chinese steelmaking.
The way this price forms has changed profoundly. For decades, ore traded on prices negotiated annually between producers and steelmakers. That rigid system gave way in the early 2010s, when the tension between Chinese demand and constrained supply made a price fixed a year ahead untenable. The market moved to pricing indexed on spot quotes, then saw active futures markets emerge — in Dalian, China, and in Singapore — that today provide a continuous quote. Iron ore thus became a high-frequency price, responsive to orders and inventories. To follow that trajectory over time, the monthly 62% Fe price history provides the full series.
One variable joins demand and supply in setting the short-term price: inventories. The ore stocks built up in Chinese ports act as buffer and signal. When they swell, they reflect downstream demand weakening or supply running ahead of consumption; when they draw down, they flag mills leaning on their reserves. A quote at a given instant therefore blends these three forces — Chinese demand, producer supply, inventory levels — which forbids reading an isolated price move as a pure demand signal.
What moves the price
Four main forces move the iron ore price, and separating them is the key to a correct reading. The first is Chinese steel demand, the dominant driver: it sets the underlying trend, swinging with construction activity and stimulus policy. The second is the supply of the major producers: supply-chain disruptions, expansion decisions or new capacity coming online can move the price independently of demand. The third is the level of port inventories, which amplifies or dampens short-term moves.
The fourth force is more indirect: the mills’ margin. Ore and coking coal are the two inputs of the blast furnace, and the gap between the finished steel price and that raw-material basket determines mill profitability. When that margin compresses, steelmakers cut output or destock, which weighs on ore even before construction demand has moved. This transmission channel through steel profitability is the subject of a specific study on the steel-margin transmission channel.
Reading a single quote well therefore means asking which of these forces is moving. A fall driven by weakening Chinese construction carries a very different meaning from one driven by a port destocking, a wave of new supply, or a margin squeeze at the mills. The four channels overlap in every print, and disentangling them is what separates the use of iron ore as a macro signal from its mere observation as a price.
Believing the Big Four set the ore price the way an oil cartel would set crude. Iron ore is a demand market: the majors influence the balance through their volumes, but the price forms at the quote, and the Chinese buyer weighs more heavily than any producer. Concentration of supply is not control of the price.
These few markers — a seaborne good destined for steel, a demand dominated by Chinese construction, a concentrated but price-taking supply, a continuously quoted 62% Fe benchmark — form the groundwork from which any quote becomes interpretable. They place iron ore within the wider set of physical commodities, treated inside the structural commodity signals hub, where each market follows its own structure of demand and supply.
Last updated — 22 September 2026
Disclaimer – Financial Information: The analyses, commentary, and content published on eco3min.fr are provided for informational and educational purposes only. They do not constitute investment advice or a solicitation to buy or sell financial instruments. Past performance is not indicative of future results. All investment decisions involve risk and are the sole responsibility of the reader.
Read next
Full pillar →Reading the refinery utilisation rate: the threshold, the season, the turnarounds
A refinery runs full near ninety percent, not a hundred: the last slice of nameplate capacity is a…
IMO 2020: the regulatory shock that rewrote product spreads
An environmental rule on marine sulfur can move a refining spread more than a swing in crude. IMO…
The 2022–2023 refining golden age: anatomy of an episode
In 2022, refined fuel prices climbed faster than crude. That gap, measured by the 3-2-1 crack spread, reached…


