
Topic
Metals & Critical Minerals
Gold answers to real rates, copper to industrial activity, uranium to power demand: each metal runs on its own driver. Supply concentration, refining and enrichment bottlenecks and the financialisation of markets, from the 2022 LME nickel squeeze to physical uranium funds, make price cycles sharper than demand alone would imply. The monthly copper price since 1986, the gold-copper ratio across 620 months and the gold-silver ratio turn these metals into macro signals.
Where to start
Three reads, in order: the basics, the full mechanism, then what the data says.
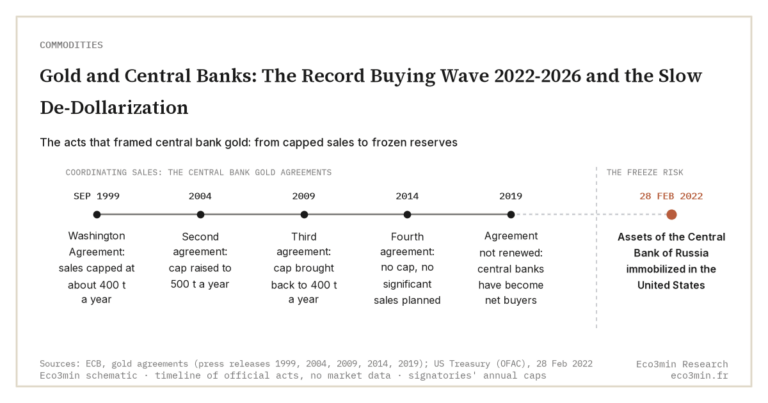 01The basics Gold and Central Banks: The Record Buying Wave 2022-2026 and the Slow De-Dollarization Central banks bought gold at a record pace in 2022-2024, then slowed in 2025: who buys, why, and what it signals about the de-dollarization of reserves. AnalysisRead →
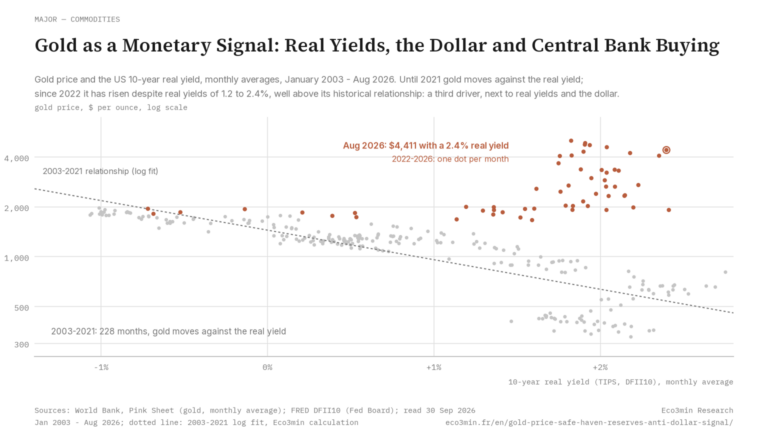 02The full mechanism Gold as a Monetary Signal: Real Yields, the Dollar and Central Bank Buying Reading the gold price beyond inflation: real yields, dollar, central bank buying, and the $3,000+ regime since March 2025. In-depth analysisRead →
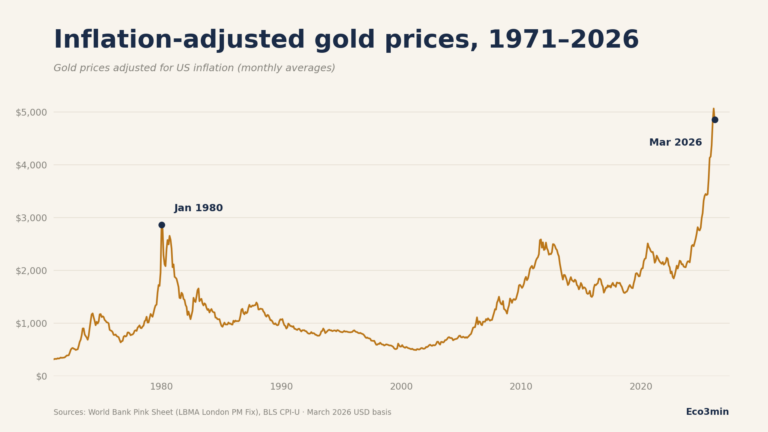 03The evidence Inflation-adjusted gold prices, 1971–2026: the January 1980 monthly peak has been exceeded Monthly average gold prices, deflated to March 2026 USD using BLS CPI-U. StudyRead →
Research and data
Our in-depth research and the downloadable series on the subject.
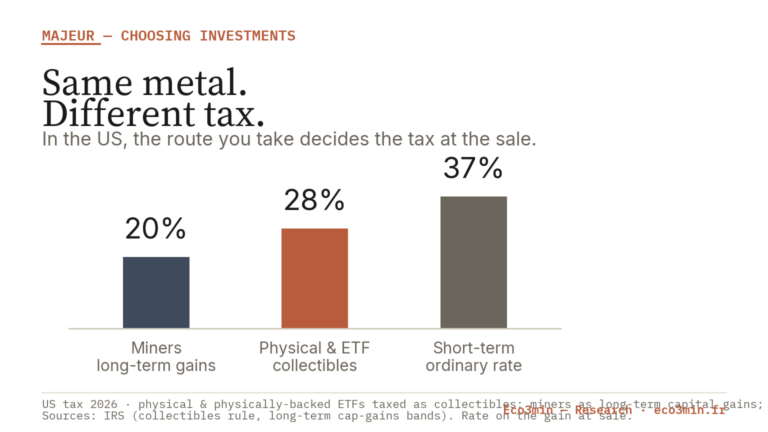 StudyHow to Invest in Gold: Bullion, ETFs, Miners and the Tax Bill at Exit
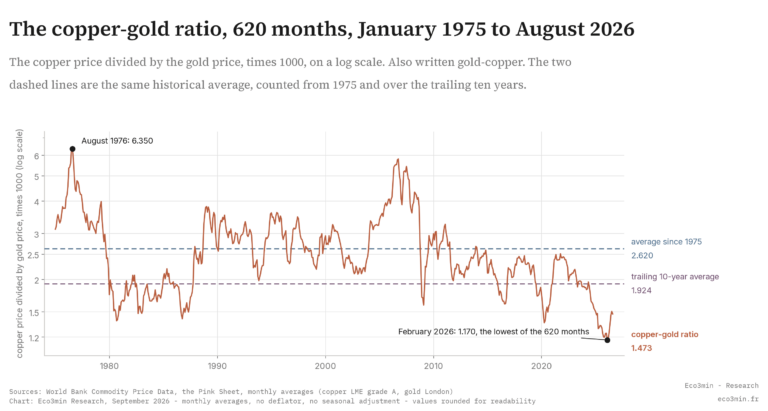 StudyGold-Copper Ratio: 620 Months Ranked Since 1975, and Why the Historical Average Is Not One Number
All analyses, by angle
Grouped by sub-topic rather than by date. Filter to get straight to the point.
Physical Commodity Markets23
The sub-pillar →- CoreUranium: The First Commodity Whose Cycle Is Driven by Compute, Not Industry Uranium crossed $100/lb in early 2026. Why AI datacenter power demand, not industry, is now shaping the commodity's structural cycle. Jun 24, 2026
- CoreWhy Nickel Is the Most Fragile Base Metal: The 2022 LME Squeeze as Structural Evidence March 2022: LME nickel more than doubled within hours and the exchange cancelled a day of trades. Jun 24, 2026
- CoreIron Ore as China’s Cleanest Construction Signal: Cyclical Trough or Peak Steel? Close to 98% of all iron ore ends up as steel, and China accounts for more than half of that steel: most of it poured into construction. Jun 24, 2026
- CoreThe Gold/Silver Ratio: Is the Oldest Precious-Metals Signal Still Reliable? Does the gold/silver ratio always revert to its mean? Jun 24, 2026
- Uranium Enrichment, SWU and the Russian Bottleneck in the Western Chain Enrichment, more concentrated than mining, is the fuel's real bottleneck: Russian dominance, surging SWU prices and a 2028 cliff for the West. Jun 24, 2026
- Uranium Explained: From Ore to Fuel, and How Its Price Forms From yellowcake to enriched fuel: how the uranium fuel cycle works and how its three prices (spot, SWU, term contract) are formed. Jun 24, 2026
- Nickel Demand: Stainless Steel, Batteries and the Two-Tier Market Nickel demand splits between stainless steel (two-thirds) and batteries. Jun 24, 2026
- The Iron Ore Market: Steel Demand, the Big Four and the 62% Fe Benchmark The iron ore market comes down to a handful of structural facts: a physical good carried by sea, four dominant producers, a 62% iron reference price, and a… Jun 24, 2026
- The 1980 Hunt Brothers Corner: Anatomy of the Largest Silver Squeeze In 1980, the Hunt brothers drove silver up to nearly $50 trying to corner the silver market. Jun 24, 2026
- Silver in Electronics and Electric Vehicles: The Largest Industrial Outlet Electrical and electronics is silver's largest industrial outlet: in the United States, 25% of its uses in 2025 according to the USGS, 40% with photovoltaics. Jun 24, 2026
- Where Does Silver Come From? A By-Product Supply That Barely Responds to Price Where does silver come from? Roughly three-quarters is a by-product of lead, zinc, copper and gold mining, making supply slow to respond to price. Jun 24, 2026
- Where Does Silver Demand Go? Industry, Jewellery and Investment, Broken Down Silver demand splits across three worlds with opposing logics: an industry that consumes and dissipates it, investors who hoard it, and traditional uses in slow retreat. Jun 24, 2026
- Asian Gold Demand: Shanghai, India and the Physical Premium China and India at the heart of the physical gold market. Jun 14, 2026
- Gold Mine Supply: Why Price Does Not Make Production Why gold mine output barely responds to price, and what the stock-to-flow ratio, the highest of any commodity, reveals about the metal. Jun 14, 2026
- Gold and US Public Debt: The Fiscal Driver US debt at records, interest above defense: how the fiscal trajectory feeds gold demand, and why the link is not mechanical. Jun 14, 2026
- The Gold/Oil Ratio: How Many Barrels an Ounce Buys The gold/oil ratio sets a monetary asset against an energy one. Jun 14, 2026
- The S&P 500 in Gold: How Many Ounces the Index Buys Pricing the S&P 500 in ounces of gold strips out inflation and monetary dilution: what the ratio reveals about secular equity-valuation cycles since 1971. Jun 14, 2026
- Iron Ore Price History: Monthly Global Price Since 2006 Iron ore price history in US dollars per dry metric ton (spot, CFR China, 62% Fe since December 2008), World Bank Pink Sheet, monthly since 2006. May 22, 2026
- Gold 1971-2026: The Major Cycles Since the End of Bretton Woods From $35/oz to $3,000/oz: the four major gold cycles since 1971, regime readings and turning points. May 19, 2026
- Gold and Real Yields: An Empirical Read of the Inverse Correlation by Sub-Period, 1997-2026 Has the gold-real-yields correlation broken in 2022-2024? May 19, 2026
- Gold: What the London Bullion Market Spot Price Actually Measures How the LBMA fixes the global gold reference price twice daily, what spot includes, and what the quotation leaves out. May 19, 2026
- Copper-Gold Ratio: Industrial Metal Versus Safe Haven, Monthly Since 1992 Copper-Gold Ratio, monthly since 1992: World Bank Pink Sheet copper (USD/t) divided by gold (USD/oz), x1000. Apr 11, 2026
- Gold/Oil Ratio: Monthly CSV Download (Since 1986) Gold/oil ratio, monthly since 1986: World Bank gold price divided by the WTI spot price (EIA). Apr 11, 2026
Other angles14
- CoreThe Copper-Gold Ratio as a Macro Signal: Still a Reliable Gauge of Treasury Yields in 2024-2026? The copper-gold ratio long tracked 10-year Treasury yields. Jun 14, 2026
- Gold to M2 Money Supply Ratio: Gold Price Divided by US Money Stock, Monthly Since 1960 Gold to M2 money supply ratio: the gold price divided by US M2, monthly since 1960. Sep 10, 2026
- Silver and Platinum as Holdings: Risk Profiles and the Gold/Silver Ratio by Regime Silver and platinum carry a dual industrial-monetary nature and higher volatility than gold. Jun 18, 2026
- From Copper to Inflation: How the Metal’s Price Transmits to Prices (PPI, CPI) Copper is an input cost: it pushes PPI first, then CPI, dampened. Jun 14, 2026
- Uranium Price History: Monthly Spot Price Since 1992 Uranium price history: what the monthly spot U3O8 series (IMF, FRED PURANUSDM) measures since 1992, its pitfalls and regimes. May 22, 2026
- Tin Price History: Monthly Global Price Since 1992 Tin price history, monthly since 1992, in USD per metric ton (LME): World Bank Pink Sheet. May 22, 2026
- Lead Price History: Monthly Global Price Since 1992 Lead price history, monthly since 1992, in USD per metric ton (LME): World Bank Pink Sheet. May 22, 2026
- Nickel Price History: Monthly Global Price Since 1992 Nickel price history, monthly since 1992, in USD per metric ton (LME): World Bank Pink Sheet. May 22, 2026
- Zinc Price History: Monthly Global Price Since 1992 Zinc price history, monthly since 1992, in USD per metric ton (LME): World Bank Pink Sheet. May 22, 2026
- Aluminum Price History: Monthly Global Price Since 1992 Aluminum price history, monthly since 1992, in USD per metric ton (LME): World Bank Pink Sheet. May 22, 2026
- Gold and Inflation: Myth or Reality of the Safe Haven Empirical test of the gold-as-inflation-hedge narrative: Erb-Harvey Golden Constant, Baur-Lucey decomposition and what 1971-2024 data show on real yields. May 1, 2026
- GOLDPMGBD228NLBM: Gold Price USD, Monthly Long-Run Reference (1960–2026, World Bank Pink Sheet) Gold price in USD per troy ounce, monthly since 1960, from the World Bank Pink Sheet (CC BY 4.0), the long-run substitute for the GOLDPMGBD228NLBM series. Apr 11, 2026
- Silver Price History: Monthly Average in USD Since 1960 (World Bank Data) Silver price history monthly data in USD per troy ounce since 1960 from World Bank Pink Sheet. Apr 11, 2026
- Real Gold Price: Monthly CSV Download (CPI-Adjusted, Since 1960) Real gold price in constant US dollars: monthly series since 1960, built from the World Bank gold price and the US CPI. Apr 11, 2026
Quick reads
Comparisons and common misconceptions: the essentials in a few minutes.
Related topics
The subjects that most often intersect with this topic in our analyses.