
Uranium Explained: From Ore to Fuel, and How Its Price Forms

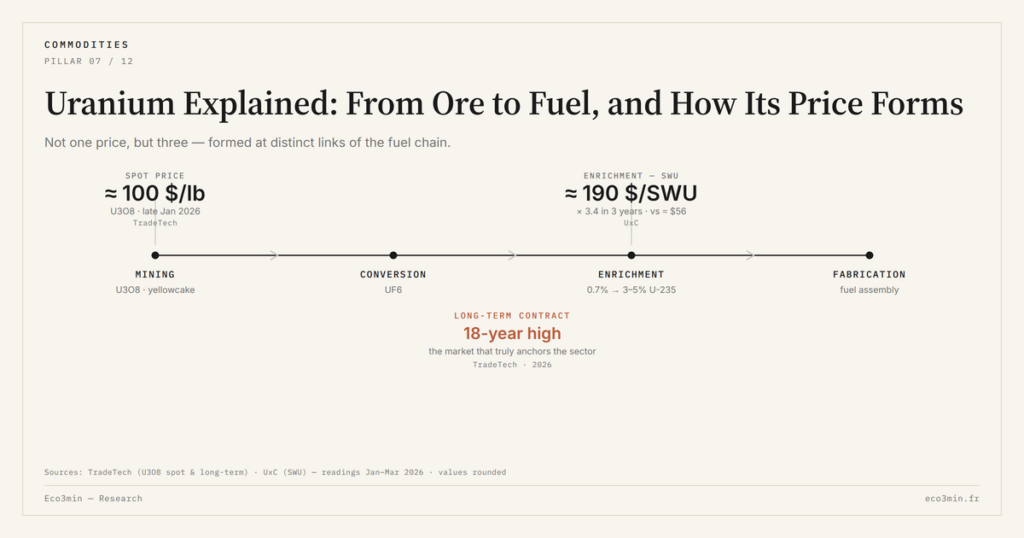
Before it can fuel a reactor, uranium moves through a long chain, from mining to fuel assembly, where each link has its own market; there is therefore no single uranium price, but three, which must be told apart to read the market.
TL;DR
Uranium trades on three distinct prices: yellowcake spot, the cost of enrichment work, and long-term contracts, and reading the market means knowing which of the three is moving and why.
- U3O8 spot, the visible figure, briefly crossed 100 dollars a pound in late January 2026, yet it covers only a thin slice of a volatile market while most volume runs through long-term contracts.
- Enrichment is priced separately in separative work units: the SWU spot reached around 190 dollars in early 2026, against about 56 dollars three years earlier.
- Natural uranium holds about 0.7 percent fissile uranium-235; most reactors need 3 to 5 percent, and producing one kilogram enriched to 5 percent takes on the order of eight SWU (World Nuclear Association).
- Secondary supply (stocks, reprocessing, reconverted military material) lets the market clear when mine output trails reactor demand; a Soviet weapons blend-down fed US reactors until it ended in 2013.
This page sets out the basic vocabulary of the fuel cycle and shows where, along the chain, value is formed, the prerequisite for reading the 2024-2026 moves at all.
From ore to fuel: the stages of the cycle
Uranium as it comes out of the ground bears no resemblance to the fuel that powers a reactor. Between the two sits a long industrial chain, each step a distinct business with its own players, lead times and price. Understanding this sequence is the condition for then locating where, in 2024-2026, the tension concentrates.
The first step is mining. Two main methods coexist. In-situ leaching, used for a large share of world output, injects a solution into the ore-bearing layer to dissolve the uranium, then pumps the loaded liquid back to the surface without excavation: it is a low-cost technique suited to low-grade deposits. Conventional mining, open-pit or underground, remains in use for richer deposits and requires processing the ore in a dedicated mill. In both cases, the product is concentrated into an oxide, triuranium octoxide (U3O8), a yellow powder commonly called yellowcake, containing about 80 percent uranium. It is in this form that uranium trades as a commodity, and it is this that the spot price quoted by the media refers to.
Yellowcake is only an intermediate step, however. It must first be converted into uranium hexafluoride (UF6), a compound that is gaseous at moderate temperature, because the enrichment that follows can only act on a gas. Conversion is itself a concentrated industry, carried out by a small number of plants worldwide, and its limited capacity is an often-overlooked bottleneck, distinct from enrichment proper. Only a handful of facilities, in North America, Europe, Russia and China, handle this step at commercial scale.
Then comes the decisive step: enrichment. Natural uranium contains only about 0.7 percent of the fissile isotope, uranium-235, the rest being non-fissile uranium-238. Most reactors need fuel enriched to 3 to 5 percent uranium-235. Raising that concentration means physically separating the isotopes, work done today by centrifuges that spin the gas at very high speed to exploit the slight mass difference between the two isotopes. Because a single centrifuge achieves only a tiny separation, the machines are arranged in cascades of several thousand units in series, with enrichment building up stage by stage. This technology has displaced the older gaseous diffusion, far more energy-hungry, and partly explains why the marginal cost of enrichment fell for years before turning. The corresponding effort is measured in separative work units (SWU): according to the World Nuclear Association, producing one kilogram of uranium enriched to 5 percent requires on the order of eight SWU, the exact figure depending on how much uranium-235 is left in the rejected stream, known as the tails. An operator can trade off consuming more natural uranium against supplying more enrichment work, depending on the relative prices of ore and SWU. This step warrants an analysis of its own, so concentrated are its players and its risk: how it works, the Russian bottleneck and the rebuilding of a Western chain are covered in the study devoted to enrichment and the SWU. Note that the new modular reactors often require more highly enriched fuel, up to around twenty percent, for which Western production capacity remains embryonic.
The final step is fabrication. The enriched uranium is converted back into a solid oxide, turned into powder, then pressed and sintered into small ceramic pellets. These pellets are stacked into metal tubes of zirconium alloy, forming rods, which are themselves bundled into fuel assemblies ready to be loaded into the reactor core, where they will stay for several years before being replaced. Placing this chain within the wider set of physical raw-material markets helps compare it with other strategic resources, but its length and technical complexity remain without equal.
The back end: what follows the reactor
The cycle does not end when the fuel is unloaded. Spent fuel, highly radioactive, is first cooled for years in pools, then often transferred to dry storage casks. From there, two logics diverge. Some countries, including France, reprocess spent fuel to extract the residual uranium and plutonium and make a mixed-oxide fuel (MOX), reducing the need for fresh ore by that much. Others, including the United States, run a once-through cycle and store spent fuel without reprocessing.
This back end explains a notion essential to reading the market: secondary supply. Beyond mining, available uranium also comes from reprocessing, from accumulated stocks, and from reconverted military material, the highly enriched uranium of dismantled warheads having long been blended down to fuel civilian reactors. For two decades, a landmark program blending down former Soviet weapons uranium supplied a large share of the fuel for United States reactors, until it ended in 2013, a reminder of how large secondary supply can loom. Added to this is the room for maneuver of enrichers, who can adjust their natural-uranium consumption depending on prices. It is this secondary supply that lets the market clear when mine output stays below reactor demand, without the lights going out: a point on which any honest reading of deficit situations rests.
Not one price, but three
From this chain follows a fact that is often missed: there is no single uranium price, but three, corresponding to three distinct links. The first is the U3O8 spot price, expressed in dollars per pound of yellowcake. It is the most visible figure, the one that briefly crossed 100 dollars a pound in late January 2026 on TradeTech’s spot indicator. But it covers only a fraction of traded volume, on a thin and illiquid market, and on its own it says nothing about the cost of finished fuel.
The second price pays for enrichment: it is the value of the separative work unit, or SWU. It measures not a quantity of uranium but an effort of isotope separation. Its level has surged, reaching on the order of 190 dollars per SWU on the spot market in early 2026 on reported prices, against about 56 dollars three years earlier. Enriching therefore costs separately, and increasingly so, independently of the price of ore.
This three-price architecture follows from the very particular nature of demand. Nuclear fuel powers a fleet of about 440 reactors worldwide, whose consumption is largely predictable: a reactor reloads only a fraction of its core every twelve to eighteen months, on a schedule known years in advance. Above all, fuel is only a modest share of the cost of generating nuclear electricity, most of which is the amortization of the plant itself. A utility therefore has every reason to secure supply over time, even at a premium, rather than expose itself to the swings of the spot market for a marginal saving. It is this security-of-supply logic, not the search for the best instantaneous price, that makes the long-term contract market the sector’s true center of gravity.
The third price is that of long-term contracts, through which utilities secure supply years ahead. This is where the real commitments are made, and the level of this price, which reached a high of more than eighteen years in early 2026, carries more information about structural expectations than spot. The cost of finished fuel therefore reads in none of these three prices alone: it combines yellowcake, conversion, enrichment and fabrication. Reading the uranium market means knowing which of the three is moving, and why.
Equating the U3O8 spot price with the price of uranium mistakes a part for the whole. Spot covers only a fraction of volume, on a thin and volatile market, while most transactions run through long-term contracts. The structural distinction between these two levels, and what the spot-to-contract gap reveals, is developed separately.
Reading the chain in 2024-2026
Once the chain and its three prices are set out, the recent moves become legible. The tension of 2024-2026 is not spread evenly along the sequence: it is sharpest at the enrichment and conversion steps, where the concentration of players is greatest, and it transmits upstream toward the ore. Above all, its origin is not industrial in the classic sense: electricity demand from artificial-intelligence data centres is rehabilitating nuclear and pulling the whole chain behind it, a mechanism developed in the analysis of the the uranium supercycle.
This page does not set out to trace the price history, available separately as a series, nor to descend into the detail of each link. It provides the map of the territory: the physical fuel chain, its back end, the existence of three prices, and the point where, today, scarcity concentrates. It is from this map that the cluster’s more specialized analyses read, whether the market’s term structure or the enrichment market. The raw record itself, the monthly spot series since 1992, is compiled in the dataset of spot prices since 1992.
Last updated — 28 June 2026
Disclaimer – Financial Information: The analyses, commentary, and content published on eco3min.fr are provided for informational and educational purposes only. They do not constitute investment advice or a solicitation to buy or sell financial instruments. Past performance is not indicative of future results. All investment decisions involve risk and are the sole responsibility of the reader.
Read next
Full pillar →Reading the refinery utilisation rate: the threshold, the season, the turnarounds
A refinery runs full near ninety percent, not a hundred: the last slice of nameplate capacity is a…
IMO 2020: the regulatory shock that rewrote product spreads
An environmental rule on marine sulfur can move a refining spread more than a swing in crude. IMO…
The 2022–2023 refining golden age: anatomy of an episode
In 2022, refined fuel prices climbed faster than crude. That gap, measured by the 3-2-1 crack spread, reached…


