
Uranium: Why Spot and Long-Term Contract Prices Diverge

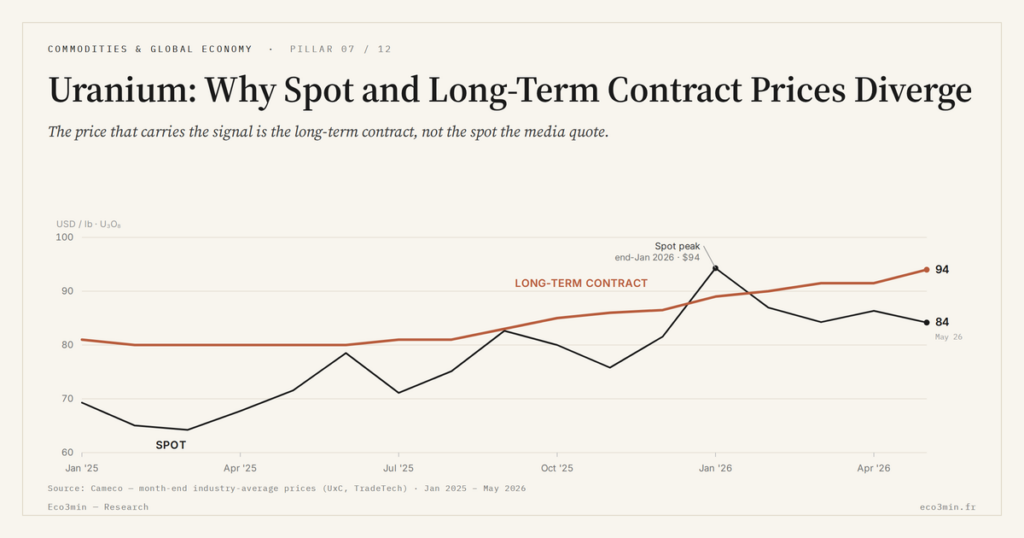
The uranium market quotes two prices: a thin, volatile spot, and a long-term contract price through which most volume trades; they diverge, and it is the contract, not spot, that carries the structural information.
TL;DR
By end-Q1 2026, uranium's long-term contract price sat about nine dollars above spot, the future-delivery price exceeding the immediate one and giving the clearer structural read.
- Most fuel trades through privately negotiated multi-year contracts between producers and utilities; the media-quoted spot covers only a handful of weekly trades on a shallow market.
- The contract price reached an eighteen-year high near 93 dollars at end-March 2026 while spot round-tripped from above 100 in January back toward 84, contracts absorbing market moves with a multi-month lag.
- A so-called contracting cliff adds upward pressure: through the low-price decade many utilities ran down coverage and signed few contracts, leaving a large share of requirements uncovered as older deals expire.
- Spot is a noisy signal: in Q1 2026 the Sprott-managed physical trust returned to buying, acquiring more than five million pounds and briefly pushing the cash price toward 100 dollars.
This page explains why spot and contract coexist and pull apart, what each signals, and why reading the wrong one misleads. Next door in the same cluster: the article on WTI Explained: Meaning, Calculation, and Cushing Spot Benchmark.
Two prices for one metal
Unlike oil or base metals, uranium does not trade mainly on a liquid cash market. The spot price, the one the media quote, covers only a fraction of traded volume: a handful of weekly transactions, often mediated by a small number of brokers, on a shallow market. Most fuel changes hands through long-term contracts, signed years ahead between producers and utilities, at privately negotiated prices. These two levels, spot and contract, are one of the three links set out in the map of uranium’s three prices.
This two-tier structure is not a technical legacy: it follows from the nature of demand. A plant operator cannot afford a fuel interruption, the cost of which is only a small share of its operating expenses. It therefore has every reason to secure supply over time, through multi-year contracts, rather than depend on the swings of the cash market for a marginal saving. The long-term contract market is thus the sector’s true center of gravity, with spot only its most visible and unstable fringe.
The two levels follow distinct formation logics. The spot price results from weekly assessments published by specialist firms, drawn from the few transactions and bids observed over the period; it can therefore move sharply from one week to the next on small volumes. Long-term contracts are negotiated case by case and take several forms: a fixed price escalated for inflation, a market-related price with floors and ceilings, or combinations of the two. This diversity of mechanisms explains why a quoted contract price is a reference average rather than a single figure, and why it reacts with a lag and reduced amplitude to spot moves.
This over-the-counter organization also reflects the absence of a deep futures market for uranium. Unlike oil or gold, whose futures trade continuously and trace a price curve for future delivery, uranium suffers from a market too thin, a heterogeneous product and long delivery lead times for such a market to take hold. Lacking a liquid forward curve, the negotiated contract price plays the role of indicator of medium- and long-term expectations, but in a more opaque and less continuous way than elsewhere. This opacity is one reason headlines gravitate to the spot price despite its limits: it is the one number quoted daily, even though it is the least representative of the market as a whole.
Why they diverge
Spot and contract move neither at the same pace nor always in the same direction, and the gap between them is itself informative. Early 2026 offers a clear illustration. The spot price briefly crossed 100 dollars a pound in late January, on TradeTech’s indicator, before falling back to 85.50 dollars by 5 February and then toward 84 dollars by the end of the first quarter. Meanwhile the long-term contract price kept climbing, reaching 93 dollars a pound at the end of March, its highest level in more than eighteen years. The cash price round-tripped; the contract traced a trend. By the end of the quarter the contract sat roughly nine dollars above spot, an unusual configuration in which the price for future delivery exceeds the price for immediate purchase, the opposite of what a glance at the headline spot number would suggest.
The direction of the divergence reads like an interpretive grid. When the long-term contract price exceeds spot, as around the turn of 2026, the market is pricing a future tightness that the more short-term cash price does not yet reflect: utilities, which reason over decades, pay a premium to secure a supply they expect to be scarcer. Conversely, when spot surges above the contract, as during the 2007 peak, it is usually a sign of short-term scarcity or a financial inflow into a thin market, which says nothing about the underlying trajectory. This premium of contract over spot, observed in early 2026, follows directly from the structural deficit between primary supply and demand described in the analysis of uranium’s supply concentration.
The gap between the two prices is not instantaneous either. Because contracts are renegotiated periodically rather than continuously, the reference contract price incorporates market moves with a lag of several months, smoothing the peaks and troughs of the cash market. Historically, spot has traded both above and below the contract depending on the phase of the cycle: well above during short-term flare-ups, appreciably below during the long stretches of depressed prices when producers preferred to sell through older, more remunerative contracts. Tracking the sign and size of that gap over time is more informative than the level of the cash price taken in isolation.
Spot, a noisy signal
If spot misleads, it is first because it is thin, illiquid and sensitive to flows that are not industrial. On a market where a few million pounds suffice to move the price, a modestly sized buyer can leave a mark. Physical funds, the best known being the trust managed by Sprott, buy fuel and pull it off the market by storing it, on a purely financial logic. In the first quarter of 2026, that trust returned to buying aggressively after several months of inactivity, acquiring more than five million pounds and helping briefly to push the cash price toward 100 dollars.
The uncomfortable question, for anyone reading spot as a fundamental signal, is therefore permanent: when the cash price rises, does it reflect genuine scarcity from utility demand, or the mechanical effect of financial buying on a shallow market? The way these investment vehicles amplify and distort the price signal is the subject of an analysis in its own right, devoted to the financialization of the spot market; here it is enough to note that the cash price aggregates, without distinguishing them, industrial demand and speculation, and is never an entirely clean signal.
Reading the right price
From this mechanics follows a reading discipline. The long-term contract price, because it aggregates the commitments of buyers who reason over time and carry most of the volume, is the best summary of the market’s structural expectations. Its climb toward an eighteen-year high says more about perceived tightness than the cash price’s round trips around 100 dollars. By contrast, a headline built on spot alone crossing a threshold captures the noisiest symptom, not the firmest signal.
Several quantities therefore deserve to be watched together rather than the cash price alone. The trend in the long-term contract price points to underlying expectations; the gap between that price and spot indicates which way the market values the future; and contracting volume, that is, the amount of fuel utilities lock in over a period, conveys the intensity of their need better than any instantaneous quote. A marked pickup in contracting activity, for instance, signals structural demand that the spot price alone, sensitive to one-off flows, can mask. These observations are descriptive: they help read the market, not anticipate its price.
Contracting activity carries particular weight at this point in the cycle. Through the decade of low prices, many utilities ran down their coverage and signed few new contracts, so a large share of their requirements is now uncovered as older contracts expire. This looming need to re-contract, sometimes called a contracting cliff, is itself a source of upward pressure on the term price, independent of any single spot move, and a tangible expression of structural demand rather than passing sentiment.
This contrast between a cash price and a forward price is not unique to uranium. On deeper markets, the relationship between the immediate price and prices for future delivery, which the term structure of oil illustrates, has long signalled expectations of scarcity or abundance. Uranium offers a more opaque version, lacking a liquid forward market, but the logic is the same: it is in the long-term commitment, more than in the price on any given day, that direction reads. This distinction is one of the threads running through the uranium market and compute demand, and it places nuclear fuel within the dynamics of physical commodity markets, where the most-quoted price is not always the most informative.
- Uranium trades at two levels: a thin, volatile spot price, covering only a fraction of volume, and a long-term contract price through which most transactions run and which is the market’s center of gravity.
- The gap between the two is informative: in early 2026 the contract reached an eighteen-year high (about 93 dollars) while spot fell back toward 84, a sign that utilities value a future tightness the cash price does not yet reflect.
- Spot is a noisy signal, sensitive to financial flows, as a physical fund’s return to buying in early 2026 showed; the structural direction reads in the long-term contract price.
Last updated — 7 July 2026
Disclaimer – Financial Information: The analyses, commentary, and content published on eco3min.fr are provided for informational and educational purposes only. They do not constitute investment advice or a solicitation to buy or sell financial instruments. Past performance is not indicative of future results. All investment decisions involve risk and are the sole responsibility of the reader.
Read next
Full pillar →Reading the refinery utilisation rate: the threshold, the season, the turnarounds
A refinery runs full near ninety percent, not a hundred: the last slice of nameplate capacity is a…
IMO 2020: the regulatory shock that rewrote product spreads
An environmental rule on marine sulfur can move a refining spread more than a swing in crude. IMO…
The 2022–2023 refining golden age: anatomy of an episode
In 2022, refined fuel prices climbed faster than crude. That gap, measured by the 3-2-1 crack spread, reached…


