Why the Euro Moves Against the Dollar: the ECB-Fed Differential and Euro-Specific Forces

To first order, EUR/USD tracks the policy differential between the ECB and the Federal Reserve; to second order, a few euro-specific forces (the energy import bill, sovereign fragmentation, the current account) explain the gaps. Understanding the euro means decomposing its move, not forecasting it.
This article sets out a framework for reading the euro against the dollar. It separates what belongs to a structural driver, what belongs to a euro-specific residual, and what is noise, without issuing any price forecast.
1. The right question is not “where is the euro heading” but “what moves it”
“Why is the euro weak” ranks among the most common searches whenever the single currency slips a few cents against the dollar. The question assumes there is a single cause and, implicitly, that one could infer what comes next. Both assumptions are fragile. A bilateral exchange rate is a relative price between two monetary areas; it moves because the balance between those areas shifts, and several forces contribute at once. Looking for THE reason behind a move already misframes the problem. The wider context: the ECB meeting calendar.
The angle here is different. EUR/USD is not reliably predictable, but it is readable: a given move can be decomposed into identifiable contributions, those contributions can be ranked by importance, and what remains irreducible can be acknowledged. Reading is not forecasting. Decomposition explains the past and illuminates the present; it does not deliver the future path, because part of that path depends on monetary-policy decisions and exogenous shocks that are not knowable in advance.
The recent period illustrates the distinction with unusual clarity. In early 2026, long euro against dollar was the dominant trade across trading desks; several houses targeted levels near 1.24 to 1.25 by year-end. Six months later, in June 2026, the pair trades around 1.14, its weakest in a year, after passing through a 1.20 peak. The directional consensus was wrong-footed, not because the original analysis was absurd, but because unforeseen elements (a geopolitical shock in the Middle East, an inflation flare-up, a simultaneous turn by both central banks) redefined the balance. That is precisely what “readable but not predictable” means: after the fact, the move decomposes cleanly; before it, it was not written.
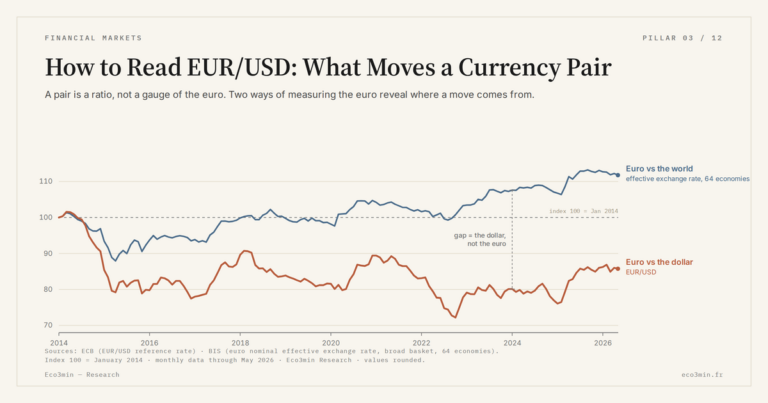
It is worth recalling what a bilateral exchange rate is. EUR/USD does not measure the euro’s “health” in the abstract; it measures the value of the euro expressed in dollars, a ratio between two areas. A fall in the pair can come from euro weakness, dollar strength, or both, in varying proportions. The point is elementary but consequential: half the information in EUR/USD concerns the dollar, and conflating the two legs is the first source of misreading. The whole work of decomposition is to separate what belongs to the euro from what belongs to its counterpart. To place the euro within the broader set of market dynamics, one can also turn to the Market Regimes pillar, which gathers the regimes of liquidity, rates, and exchange. The logic of this article is to start from the most powerful driver and then descend toward more specific forces, measuring at each step what is genuinely explained.
Saying the euro is readable is not saying it is inefficient. A market can correctly price all available information and still be unpredictable, simply because future information does not yet exist. Readability concerns the structure of the forces, not the path: it asserts that at any moment the price reflects a decomposable balance between differential, own forces, and risk premium, without claiming to know the next surprise that will shift that balance. It is an intermediate position between the fatalism of “everything is random” and the illusion of “everything is predictable.”
2. The first-order driver: the ECB-Fed policy differential
The force that explains the largest share of EUR/USD variation over horizons of a few weeks to a few quarters is the monetary-policy gap between the European Central Bank and the Federal Reserve. The logic is direct: capital placed without currency risk earns more where short rates are higher; when the rate gap shifts in favour of one area, flows and expectations tend to appreciate its currency. The important word is “shifts.” It is not the absolute level of the gap that imprints a move, but its change and, above all, its expected direction. This rests on the mechanics of foreign exchange covered in detail in how foreign exchange markets work.
2.1 Policy rates and the two-year segment
The differential can be read at two levels. The first is policy rates. As of June 2026, the ECB deposit rate stands at 2.25% following a 25 basis-point hike on 11 June, its first increase since 2023; the main refinancing rate is 2.40%. On the US side, the Fed held its federal funds range at 3.50%–3.75% on 17 June, unchanged for a fourth consecutive meeting. Documentation: the ECB’s official key interest rates. The policy gap is therefore roughly 1.4 percentage points in the dollar’s favour. That level, on its own, says little about direction: it is compatible with a rising euro and with a falling one.
The second level, more informative, is market rates at two years (German Bund versus US Treasury). The two-year yield aggregates expectations of policy rates over the horizon where most of the divergence plays out; it moves ahead of decisions, as soon as the market re-prices each central bank’s likely path. It is this more reactive version that EUR/USD analysis favours. When the German front end rises faster than its US equivalent, the euro tends to appreciate, and vice versa. The policy rate is the snapshot; the two-year is the film.
Between the policy rate and the two-year sits the effective overnight rate, the euro short-term rate for the euro area, which anchors the very front end. It is the starting point of the curve: the policy rate sets the overnight rate, expectations of the path propagate the move along the curve to the two-year, then to the ten-year. For reading the exchange rate, the useful information concentrates on the short segment, where policy decisions matter most; the ten-year, more sensitive to term premia and growth prospects, is a poorer proxy for the differential relevant to EUR/USD.
2.2 What the EUR/USD and two-year differential overlay shows
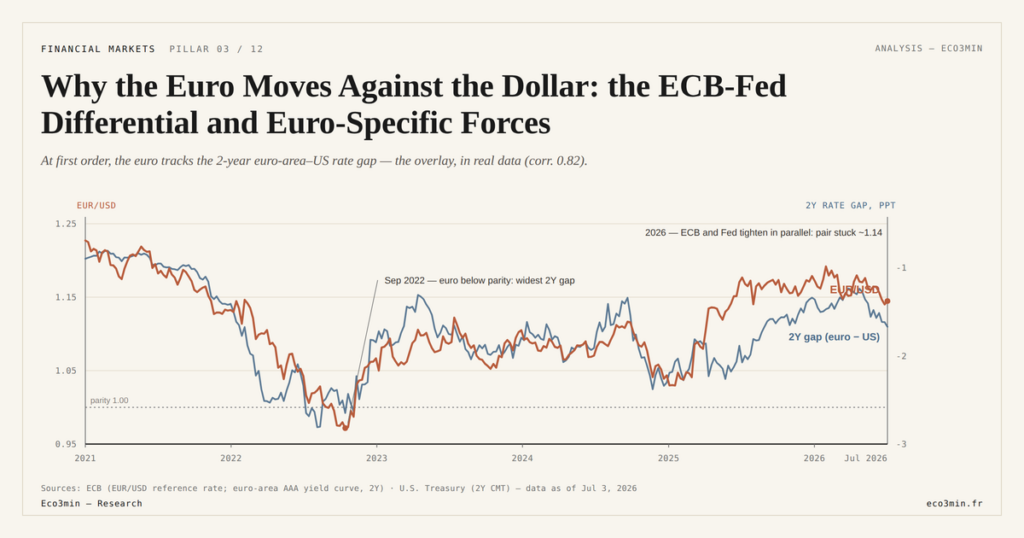
Overlaying the EUR/USD curve and the two-year Bund-Treasury yield gap produces the central artefact of this analysis. Over long windows, the two series track each other closely: trending phases in the pair coincide with phases of widening or narrowing in the differential. The correlation is no coincidence; it reflects the mechanism described above. This is the first-order reading, and it accounts for a majority of the major moves.
But the overlay reveals something else, and this is where the analysis becomes interesting: windows where the two curves decouple. The differential moves one way, the euro the other, or the euro moves while the rate gap stays flat. These decouplings are not random noise. They measure the share of the move that the monetary driver does not explain: the euro-specific residual. When the correlation holds, the differential suffices; when it breaks, a second-order force specific to the euro area has taken over. Identifying these windows isolates the moments when the energy bill, sovereign fragmentation, or the current account becomes the dominant factor.
What a decoupling looks like in practice is instructive. In 2022, the euro fell further than the rate gap alone implied: the differential was already wide in the dollar’s favour, but the additional leg down to 0.9536 came from the energy and current-account shock, a residual that the monetary overlay could not capture. Conversely, in phases where the euro holds up despite an adverse rate gap, the residual is working in the other direction, often through a strong current account or contained sovereign spreads. Reading the gap between the pair and its monetary driver is therefore not a footnote; it is where the euro-specific story lives.
This artefact has a virtue its rivals lack: it is reproducible. The overlay can be rebuilt from public series, the two-year sovereign yields on both sides and the exchange-rate series, with no proprietary data and no hidden assumption. A reader can verify the correlation, spot the decoupling windows independently, and judge on the evidence. That is the difference between a sourced decomposition and a narrative explanation: the first exposes itself to refutation, the second merely asserts. The historical series itself is available in the EUR/USD history dataset.
The ECB-Fed differential warrants a dedicated treatment of its own: transmission mechanics, precise rate series, historical episodes of divergence. That is the subject of the analysis on the ECB-Fed differential that drives the pair, which extends this framework to the first order alone. The present article remains the umbrella: it places the differential among the other forces rather than detailing its transmission.
2.3 How the differential transmits to the exchange rate
The channel through which the rate gap acts on the currency combines two logics. The first is portfolio flows: at comparable risk, global savings are drawn to the assets offering the highest yield, supporting demand for the corresponding currency. The second, subtler, runs through expectations. In efficient markets, what matters is not the current yield but its expected path: a rate that is already high but expected to fall is less supportive than a lower rate trending up. That is why the two-year segment, which condenses these expectations, explains the exchange rate better than the policy rate of the moment.
The reference theory, uncovered interest parity, holds that in equilibrium the yield gap between two currencies should be offset by an expected depreciation of the high-yield currency, so that no systematic gain survives. In practice, this relationship is regularly violated in the short run, leaving a currency risk premium: investors demand compensation for bearing a currency’s risk, and that premium fluctuates with global risk appetite. The rate differential therefore does not transmit mechanically; it acts as modulated by this premium, which explains part of the observed decouplings.
A practical consequence follows. Surprises matter more than levels. A central-bank meeting in line with expectations should not, in principle, move the pair even if it changes the rate; a gap between the decision or the message and what was anticipated does shift the expected differential and, with it, the exchange rate. Reading EUR/USD therefore means reasoning in terms of deviations from expectations, not announced levels.
2.4 What the money market reveals about the differential
The expected differential is read in money-market prices. Contracts indexed to short rates allow an implied probability to be extracted for each central-bank meeting. At the end of June 2026, these instruments assigned roughly 89% probability to the ECB holding its deposit rate at 2.25% at the 23 July meeting, while leaving open the possibility of a further hike before year-end. On the US side, the median projection of Fed members placed the federal funds rate at 3.8% by end-2026, above the level then prevailing, signalling the prospect of a hike rather than a cut.
This dual reading confirms the near-parallelism diagnosis: both money markets embedded a cautious hawkish bias, with no clear directional divergence. It is this absence of a clear signal, more than the level of the gap, that kept the pair in a narrow range. The euro-area policy rate and yield series are available in the broader monetary dataset infrastructure of the site, which allows the differential to be reconstructed over long periods.
3. 2022 versus 2026: why the same energy shock does not produce the same euro
The clearest demonstration that it is the differential’s direction that dominates, not its level alone, lies in comparing two episodes that share one ingredient (an energy shock hitting Europe) but produce opposite outcomes for the currency.
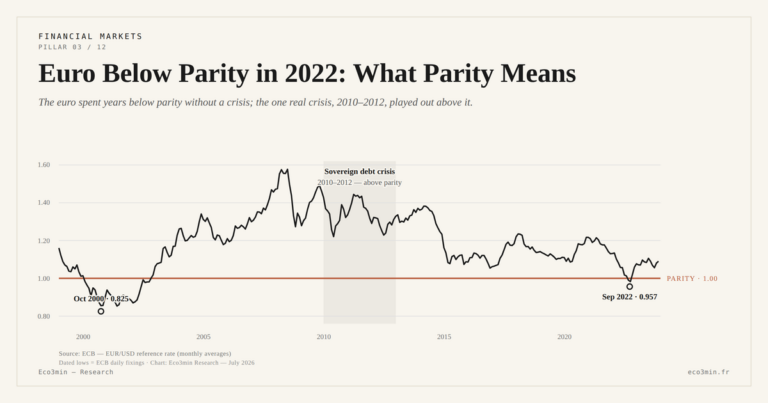
In 2022, EUR/USD fell below parity, touching 0.9536 in September, its lowest since 2002. The configuration was unambiguous: the Fed was raising rates aggressively and held an advantage close to 300 basis points (283 on 2-year yields in August 2022, ECB and U.S. Treasury), while the euro area was suffering a recessionary energy shock after the invasion of Ukraine, with gas prices at extremes and German industrial output contracting. Maximal monetary divergence in one direction, an adverse real shock in the same direction: both forces pushed the euro down in convergent fashion. The result was a move of large amplitude.
In 2026, the energy ingredient is back. The Middle East conflict and disruptions around the Strait of Hormuz lifted energy prices; WTI crude rose from around 57 dollars early in the year to a 113-dollar peak in April, before easing back to about 76 dollars. Euro-area inflation climbed to 3.2% in May, its highest since 2023. But the monetary configuration is, this time, radically different. The ECB is not behind: it raised rates in June. The Fed is not easing: it held its range and lifted the median projection of its members for end-2026 to 3.8%, signalling a hawkish bias. Both central banks lean the same way, in parallel. There is no clear directional divergence, hence no first-order driver imprinting a trend. That is precisely why the pair stays “stuck” around 1.14 despite a comparable energy shock, where 2022 had produced a collapse.
Update (September 2026). The parallelism was confirmed: the ECB raised its deposit rate to 2.50% (effective 16 September) and the Fed its range to 3.75%–4.00% on 17 September, the first US hike of the cycle. WTI climbed back toward 107 dollars in mid-September and euro area inflation stood at 3.2% in August. The pair itself did not change order of magnitude: 1.16 on 11 September (Federal Reserve, ECB, FRED).
The lesson is structural. An identical shock to a second-order force (energy) does not produce the same effect depending on the state of the first-order force (the differential). In 2022, the energy shock amplified an already violent monetary divergence. In 2026, the same type of shock sits within near-parallel policies, where it weighs on imported inflation and the terms of trade without triggering a wide directional move. The 2022 episode deserves to be decomposed in its own right, not least because it popularised the misleading idea that “parity equals crisis”; that is the subject of the analysis on the euro’s drop below parity in 2022.
3.1 The framework across the euro’s major regimes
The same lens illuminates the pair’s history since inception. At its 1999 launch, the euro traded around 1.18 dollars, before losing ground to a trough near 0.82 in late 2000: the young currency suffered from a growth and rate differential clearly favouring the United States during the technology boom. The first-order driver was already at work, in the dollar’s direction.
The opposite move peaked in July 2008, when the euro reached a high near 1.60 dollars. The configuration was the mirror image of 2000: the Fed had cut rates in the face of the first financial tremors while the ECB held, and the yield gap had shifted in the euro’s favour. Here again, the differential’s direction accounted for most of the amplitude.
The 2014–2015 decline, which took the pair from around 1.39 to near 1.05, offers the purest illustration of the mechanism. The ECB was launching quantitative easing and pushing its deposit rate into negative territory, exactly as the Fed exited its asset-purchase programme and prepared to raise rates. Two central banks moving in opposite directions: divergence was maximal, and the euro fell by about a quarter without any European real shock being necessary. It is the textbook case where the differential alone explains everything.
Between 2017 and 2021, the pair oscillated in a wide range without a dominant trend, both central banks staying broadly accommodative. The 2020 pandemic first triggered a rush into the dollar at the height of risk aversion, before the scale of stimulus and the weakness of US rates supported the euro to levels near 1.23 in early 2021. That phase is a reminder that, absent clear monetary divergence, the exchange rate drifts on second-order forces and flows, without strong direction, exactly as in 2026. And 2022 adds the layer of the euro-specific residual: monetary divergence was overlaid with a recessionary energy shock, and the two forces converged to push the pair below parity. The sequence (2000, 2008, 2014–2015, 2022) read through the same grid shows that the framework is not an after-the-fact rationalisation of a single episode but a stable structure: each time, the differential’s direction sets the first order, and the euro’s own forces adjust the amplitude.
4. The euro’s own forces: the second-order residual
Once the monetary driver is in place, what remains are the forces that explain the decouplings, the windows where the euro departs from what the differential would suggest. Three families dominate: terms of trade via the energy bill, sovereign fragmentation, and the current account. They share one feature: they are specific to the euro area and have no symmetric equivalent on the dollar side. That is what distinguishes them from the dollar’s systemic role, treated elsewhere; here, the dollar appears only as the opposite leg of the differential.
4.1 The energy bill and the terms of trade
The euro area is structurally a net energy importer. When the price of imported energy surges, the area must pay more foreign currency for the same volume of gas and oil; its terms of trade deteriorate, its trade balance worsens, and selling pressure on the euro rises. This channel is mechanical and played a leading role in 2022, when the spike in gas turned a historic trade advantage into a deficit. It still operates in 2026, at lower intensity, via the rise in energy prices tied to geopolitical tensions.
The mechanics of the terms of trade deserve to be spelled out. When an area imports energy priced in dollars, a rise in that energy’s price directly increases its demand for dollars to settle imports, which weighs on its currency. The effect is twofold: it degrades the trade balance in value terms, and it feeds domestic inflation, forcing the central bank to arbitrate between supporting activity and containing prices. That is why an energy shock strikes the euro through two simultaneous channels, external trade and monetary policy, which reinforce one another in acute episodes.
The magnitude of the 2022 swing illustrates the point. A region that had run a structural trade and current-account surplus for years saw it erode and turn negative as the energy bill ballooned, a reversal of historic proportions for the euro area’s external balance. The gas dimension was central: unlike oil, which trades in a globally integrated market, gas was priced regionally, so the European price could and did decouple sharply from the US price, turning an input cost into a competitiveness and currency shock specific to the area. The euro’s weakness that year was thus not a pure rate story; it was a terms-of-trade story layered on top of a rate story.
The European specificity lies in import dependence and particular exposure to gas, whose market is not globally integrated like oil. The fracture between European and US gas prices was a distinct competitiveness and exchange-rate factor; it is analysed in detail in the fractured global gas market. For the full mechanism linking the gas shock, the terms of trade, and currency weakness, the dedicated analysis treats the euro’s energy import bill as a standalone driver of the exchange rate.
4.2 Sovereign fragmentation: a currency without a single sovereign
The euro has a feature without equivalent among the major currencies: it is issued by a monetary union without a complete fiscal union, hence without a single sovereign behind it. Nineteen sovereign debts coexist under the same currency, with different credit qualities. When the market doubts the area’s cohesion, it demands a higher risk premium on peripheral debt, and that premium can weigh on the euro itself as a latent redenomination risk.
The reference indicator is the yield gap between Italian and German ten-year debt, the BTP-Bund spread, complemented by the OAT-Bund gap for France. Historically observed thresholds serve as reading benchmarks, with no prescriptive value: below roughly 150 basis points, the gap is generally seen as manageable; between 200 and 300, it signals stress that warrants monitoring; above 400, it has accompanied exceptional ECB interventions in the past (the SMP programme in 2011, the OMT announcement in 2012, the creation of the Transmission Protection Instrument, the TPI, in 2022). Italian debt, around 140% of GDP, is the heart of this mechanism. The reference precedent remains the 2010–2012 eurozone crisis, when the widening of peripheral spreads raised the prospect of the currency breaking apart, until the central bank affirmed its commitment to preserving the union. The full spread series is available in the BTP-Bund spread series, and the complete decomposition of this channel is the subject of the analysis on eurozone sovereign fragmentation.
This force is not continuously active. Most of the time, sovereign spreads stay contained and fragmentation does not influence the exchange rate. But it constitutes a tail specific to the euro: a risk that can, in certain configurations, suddenly become the dominant factor and pull the currency away from its monetary driver. It is an asymmetry. Fragmentation never supports the euro; at best it is neutral, at worst it weighs.
The creation of the TPI in 2022 changed the nature of this risk without removing it. The instrument allows the ECB to buy, in targeted fashion, the debt of a state whose financing conditions deteriorate in a manner judged unwarranted, in order to preserve the transmission of its policy across the whole area. Its existence acts as a conditional safety net: it caps, in theory, the widening of spreads tied to pure speculation, while leaving in place the risk attached to a country’s fiscal fundamentals. For the exchange rate, this means fragmentation has become a better-contained risk, but one that remains a potential source of euro-specific weakness.
4.3 The current account and positioning
Beyond energy and fragmentation, the euro area’s current account provides a medium-term anchor. An area in structural current-account surplus exports savings and benefits, all else equal, from underlying support for its currency; a deterioration of that surplus removes the support. The 2022 energy shock precisely eroded a historic current-account surplus, which amplified euro weakness beyond the effect of the rate differential alone.
Speculative positioning adds a shorter-term layer. When a directional view becomes consensual (long euro in early 2026, for instance), the market loads up one way, and an unwind of those positions can amplify moves when the narrative turns. Positioning is not a fundamental cause; it is an accelerator that explains why adjustments are sometimes sharper than fundamentals alone would justify.
A final mechanism, often overlooked, links the exchange rate to the area’s external wealth. The net international investment position holds assets and liabilities denominated in different currencies; a move in the euro changes the euro value of those positions, independently of any flow. For an area holding dollar assets and euro liabilities, a fall in the euro mechanically raises the value of its external assets. These valuation effects do not create a trend, but they explain why the impact of an exchange-rate move on an economy is not limited to its effect on current trade.
One often reads that “the euro is weak because the ECB is behind the Fed.” The phrase confuses the level and the direction of the differential. An unfavourable but stable rate gap imprints no trend; it is the expected change in that gap, combined with the euro’s own forces, that moves the pair. Reading the level of the differential alone leads to repeated errors.
5. Reading, not forecasting: what “readable” means methodologically
The framework developed so far is one of decomposition, not forecasting. The distinction is not a verbal precaution; it follows from the structure of the problem. The future path of EUR/USD depends on variables not known today: the coming decisions of the ECB and the Fed, the evolution of a geopolitical shock, the behaviour of energy prices. Decomposing a past move is a tractable exercise; extrapolating the future composition assumes forecasting those variables, which belongs to another order of uncertainty.
What readability does allow, by contrast, is valuable. It allows one to understand why a move occurred, attributing a share to the differential and a share to the specific residual. It allows one to recognise, in real time, which of the two regimes dominates: when the EUR/USD-differential correlation holds, the steering is monetary; when it breaks, a euro-specific force has taken over. And it allows one to avoid the most common errors, including the claim to infer a price target from an observed correlation.
The difference between scenario analysis and point forecasting is decisive here. Describing how the pair would react depending on whether the two central banks diverge or stay parallel is analysis: one spells out conditional relationships without asserting which will occur. Announcing a level for a given date is forecasting: one picks a scenario and suppresses its uncertainty. The first approach is robust and informative; the second gives a false sense of mastery. The whole point of honest reading is to stay in the conditional, mapping the dependencies without claiming to settle the future. The 2026 case is instructive again: the early-year consensus rested on a reasonable view (a convergence of policies favourable to the euro), but that view was conditional on assumptions that did not materialise. For the reader new to currency pairs, the step-by-step decomposition of what moves a rate is presented in accessible form in how to read a currency pair in practice.
The epistemic status of a sourced framework is worth stating plainly. Grounding an analysis in public data and an explicit mechanism makes it more defensible, but it does not turn it into a forecast. The data document what has happened and how the forces relate; they do not contain tomorrow’s policy decision or geopolitical event. A well-sourced decomposition is therefore strong precisely where forecasting is weak (explaining structure) and silent precisely where forecasting overreaches (naming a future level). Confusing the two would import the rigour of the first into a claim the second cannot support.
The decomposition proceeds in three steps. First, the EUR/USD move is related to the change in the two-year Bund-Treasury differential: this is the first-order contribution. Next, the residual is measured, the unexplained share, and attributed to the euro’s own forces (energy, fragmentation, current account) according to context. Finally, what remains is acknowledged as irreducible noise, without trying to rationalise it. The order matters: starting from the residual without first establishing the driver leads to over-interpreting coincidences.
6. The exchange rate as transmission: feedback to inflation and competitiveness
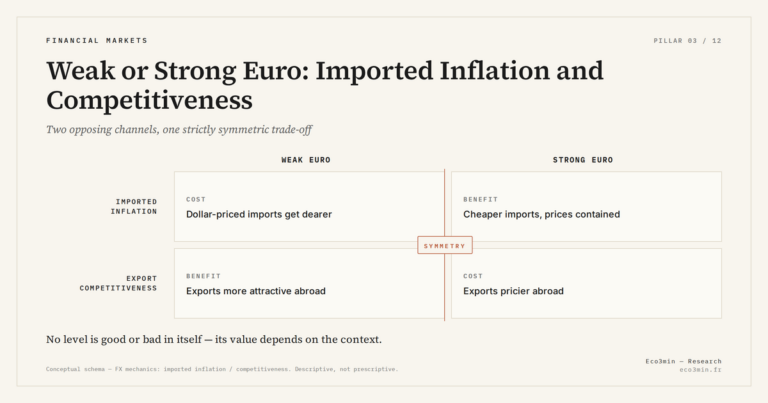
EUR/USD is not only an outcome; it is also a cause. The currency’s level transmits to the real economy through two main channels, which close the loop with monetary policy. The first is imported inflation: a weaker euro raises the euro cost of goods and commodities priced in dollars, feeding inflation and potentially weighing, in turn, on ECB decisions. The second is competitiveness: a weaker euro lowers the foreign-currency price of European exports, supporting exporters, while a stronger euro does the reverse.
These effects are descriptive and asymmetric across agents. The same euro move does not carry the same meaning for an importer, an exporter, a saver, or a traveller. The pass-through of the exchange rate to imported inflation and competitiveness, treated without prescription, is the subject of the analysis on the pass-through to imported inflation. This loop also explains why the exchange rate is, for a central bank, both a channel of policy transmission and a constraint it monitors without explicitly targeting.
The asymmetry across agents deserves emphasis, again descriptively. A weaker euro raises dollar-priced purchases for an importer and the cost of travel outside the euro area for a household, while it improves an exporter’s price competitiveness and the euro value of dollar-denominated revenue. There is therefore no “good” or “bad” level of the euro in the abstract: the same move creates winners and losers depending on each agent’s position in international flows. This plurality of exposures is one more reason to stick to analytical reading, without turning an observation into a recommendation.
Pass-through to the real economy is neither immediate nor complete. The transmission from a euro move to consumer prices spreads over several quarters and is only partial, because importer margins, currency hedging, and the composition of the consumption basket cushion the shock. Likewise, the effect on exports depends on the price elasticity of the goods concerned, lower for premium goods than for substitutable ones. These lags and dampening effects explain why an exchange-rate move shows up in inflation and trade figures only with delay, and in muted form.
A further channel deserves mention, because it links the rate differential directly to capital flows: the carry trade, which consists of borrowing in a low-yield currency to invest in a higher-yield one. The rate gaps that animate EUR/USD also feed these strategies, whose unwinds can amplify currency moves. Without re-explaining it here, we refer to the carry trade as another channel, which details its mechanics and fragility.
7. Placing the euro without confusing it with the dollar’s role
A framing point is needed to avoid a common confusion. Reading the euro through EUR/USD is not reading the dollar. The dollar plays a global systemic role that goes far beyond its bilateral relationship with the euro: invoicing anchor, reserve currency, benchmark for global financial conditions. That role is read through its own instruments, such as the trade-weighted dollar index, analysed via the broad dollar index as a systemic signal. In the present framework, the dollar appears only as a counterpart: the opposite leg of the ECB-Fed differential, and the denominator of the energy bill.
This distinction has a practical consequence. When the dollar strengthens against all currencies for systemic reasons (global risk aversion, dollar liquidity demand), the euro falls, but that move is not “euro-specific”: it reflects dollar strength, not a specific euro-area weakness. Separating the two is essential so as not to attribute to the euro what belongs to the dollar. It is also why the decomposition starts with the differential, which isolates precisely the relative component between the two areas, before examining the unilateral forces on each side.
The dollar’s safe-haven status adds a further asymmetry. In times of global financial stress, demand for dollars rises independently of rates, because the US currency remains the settlement and reserve money of last resort. The euro then tends to fall, but that move reflects dollar strength tied to risk aversion, not a deterioration of European fundamentals. Conflating the two leads to diagnosing a “euro crisis” where there is only a flight to dollar liquidity. The distinction matters all the more because the two phenomena can overlap, as in 2022, when the euro’s own weakness and the dollar’s safe-haven strength acted in the same direction.
This is why the dollar tends to behave cyclically against the euro in a recognisable pattern: it can strengthen both when the US economy outperforms and rates diverge in its favour, and when global stress drives a flight to liquidity, even if the US is the source of the stress. The euro, lacking an equivalent global safe-haven role, sits on the other side of both dynamics. Reading EUR/USD therefore requires asking, at each move, whether the dollar leg is being driven by relative growth and rates or by risk aversion, because the two have very different implications for what comes after and for which of the euro’s own forces, if any, is also in play.
8. The limits of the framework
No decomposition framework is complete, and it is honest to mark its limits. The first is the irreducible residual: even after attributing the differential and the euro’s own forces, part of the move remains unexplained. That part is not zero and grows over short horizons, where noise dominates. Claiming to explain everything would be over-interpretation.
The second limit is the instability of regimes. The relative weight of the forces is not constant. There are periods when the differential explains almost everything, and others when fragmentation or energy takes over. The framework indicates what to watch, not in what proportion at a given moment; those proportions are read after the fact, not before. A model that fixed the weights would give a false impression of precision.
That instability exposes one to overfitting. It is tempting, faced with a strong correlation over a given period, to turn it into a law and extrapolate. But a relationship calibrated on a particular regime loses its validity when the regime changes, and finance abounds in relationships that worked perfectly until the day they stopped. Prudence means treating the decomposition as a qualitative, revisable reading grid rather than a predictive model with fixed coefficients. The framework is worth its structure, not a numerical precision it cannot honestly claim.
The third limit is reflexivity. Agents’ expectations are part of the system: when a narrative becomes consensual, it changes positioning, hence prices, hence the next narrative. This loop makes the dynamics partly self-referential and explains why moves can feed on themselves or reverse sharply without new fundamental information. It is one more reason to read past contributions rather than extrapolate a path.
The distinction between explanatory and predictive power underlies all of this. A framework can have high explanatory power, accounting cleanly for moves after the fact, and still have low predictive power, because the inputs that drive future moves are themselves unknown. The two are routinely conflated, and the conflation is the source of much false confidence in currency analysis. The honest claim here is narrow but solid: the decomposition explains, it orders, it flags which variable is in control; it does not predict, and it does not pretend to.
8.1 The variables the framework points to
The framework does not say when the euro will rise or fall, and it designates no level to aim for. It does indicate which variables concentrate the information, which is different. The first is the two-year yield gap between Bund and Treasury, whose change carries the first order of the move. The second is the set of sovereign spreads, BTP-Bund and OAT-Bund, which signal the possible activation of the fragmentation channel. The third is the area’s energy bill, readable in the terms of trade and the trade balance. The fourth is the current account, which provides the medium-term anchor. Observing the coherence or divergence between these variables and the pair’s level is what the decomposition makes possible; drawing a decision from it belongs to another exercise, outside the scope of this analysis.
EUR/USD decomposes: the direction of the ECB-Fed differential governs the first order, the euro’s own forces explain the gaps, and the rest is noise that no price target captures.
Conclusion
The euro does not lend itself to prediction, but it lends itself to reading. Behind each EUR/USD move there is a structure: a monetary driver whose direction, not level, imprints the trend; a set of euro-area-specific forces (energy, fragmentation, current account) that explain the gaps to that driver; and a residual that analytical honesty requires leaving as it is. The comparison of 2022 and 2026, where a comparable energy shock produces opposite paths depending on the state of the differential, captures the essential: it is not the ingredient that decides, it is the configuration. Understanding the euro means holding these layers of reading together, and resisting the temptation to reduce a complex relative price to a single cause or a target.
- The first-order driver of EUR/USD is the direction of the ECB-Fed policy differential, better read through two-year Bund-Treasury rates than through policy rates alone.
- Decouplings between the euro and the differential measure the euro-area-specific residual: the energy bill, sovereign fragmentation, the current account.
- 2022 (convergent divergence and energy shock, euro at 0.9536) and 2026 (parallel policies, pair near 1.14 despite an energy shock) show that it is the configuration, not the ingredient, that decides.
- Fragmentation is an asymmetric force: it never supports the euro, it is neutral or it weighs.
- The framework decomposes the past and illuminates the present; it does not deliver a future path, because part depends on decisions and shocks unknown in advance.
Last updated — 20 September 2026
Disclaimer – Financial Information: The analyses, commentary, and content published on eco3min.fr are provided for informational and educational purposes only. They do not constitute investment advice or a solicitation to buy or sell financial instruments. Past performance is not indicative of future results. All investment decisions involve risk and are the sole responsibility of the reader.
Read next
Full pillar →Eurozone Fragmentation: Sovereign Spreads and the Euro
The euro is issued by a monetary union without a complete fiscal union: nineteen sovereign debts coexist under…
The Euro’s Energy Import Bill: the Gas Shock and the Currency
In 2022, the surge in gas prices turned the euro area's historic current-account surplus into a deficit and…
The ECB-Fed Rate Differential: the Driver of EUR/USD
The rate differential between the ECB and the Fed is the first-order driver of EUR/USD. But it is…