
Copper and Electrification: Does Structural Demand Change the Metal’s Cyclical Read?

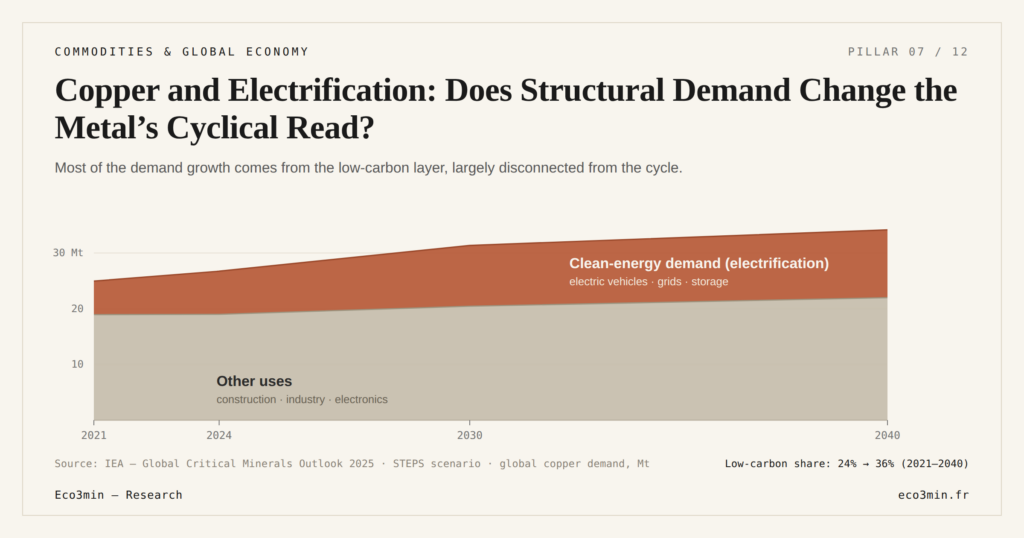
Copper demand splits between cyclical uses, tied to the pace of activity, and a structural layer driven by electrification. That second component, indifferent to the cycle, blurs the metal’s read as a growth barometer.
TL;DR
Copper demand stacks a cyclical layer tied to activity onto a structural layer driven by electrification; the second, indifferent to the cycle, erodes the metal's read as a growth gauge.
- A battery electric vehicle uses 83 kg of copper against 23 for a combustion car (International Copper Association, 2017); the IEA's reference case lifts copper demand from about 27 Mt in 2024 to nearly 37 Mt by 2050, on a timetable set apart from the cycle.
- Supply is inelastic: close to sixteen to seventeen years from discovery to production and ore grades down about 40% since 1991, so a price rise can reflect scarcity rather than a surge in present demand.
Separating the two drivers clarifies why copper can set records while the economy softens. What matters is not the price level, but what it actually measures.
A copper demand made of two distinct layers
Copper earns its standing as a cyclical gauge from its presence in construction, industry and capital goods, whose demand tracks the business cycle. But that demand is not homogeneous. One part, long-standing, depends on the pace of activity: housing starts, manufacturing output, corporate investment. Another, more recent, comes from the electrification of the economy — vehicles, grids, storage — and grows on a secular logic largely disconnected from the current quarter. Reading copper as a single thermometer conflates these two strata.
That distinction sits at the heart of the copper-gold ratio’s breakdown against bond yields, of which it forms one of the two legs. As long as cyclical demand dominated, the copper price offered a readable signal on the state of growth; as the structural layer gains weight, that signal carries information no longer about the cycle. Placing the metal within commodity cycles and the macro regime shows that its value as an indicator depends on the composition of its demand, not on its price level alone.
The balance between these two layers has shifted. Twenty years ago, copper demand was almost entirely set by the industrial and property cycle, led by China; the share tied to the energy transition was marginal. It is today a recognized driver of global demand, and its growth follows the equipment timetable — vehicle fleets, renewable capacity, grid upgrades — rather than the business cycle. The two layers therefore answer to different variables: the first to current activity and rates, the second to long-term electrification targets and industrial policy. The more the second weighs, the less the aggregate price tells us about the first.
What electrification adds, and why it lasts
The scale of the structural layer shows first in the copper intensity of new uses. A battery electric vehicle uses 83 kilograms of copper, against 23 for a combustion car, according to an IDTechEx study published by the International Copper Association in June 2017; add electrical grids, storage and the build-out of data centers for artificial intelligence. The International Energy Agency projects, in its reference case, copper demand rising from about 27 million tonnes in 2024 to nearly 37 million by 2050, and a supply shortfall on the order of 30% by 2035; in its STEPS scenario, the share of low-carbon uses (electric vehicles, grids, storage) in copper demand rises from 24% in 2021 to 36% in 2040. These volumes do not depend on the state of the cycle, but on a long-term equipment timetable.
The supply side confirms how durable the tension is. The IEA and S&P Global estimate it now takes close to sixteen to seventeen years to move a mine from discovery to production, while average ore grades have fallen by roughly 40% since 1991. Mining executive Robert Friedland has summed up the constraint: to sustain 3% global growth, before electrification even enters, the world would need to mine as much copper over two decades as in all of recorded history. Supply that inelastic means a price rise can reflect scarcity rather than a surge in present demand. Copper is not alone in this: copper against other industrial metals reveals paths the cycle alone cannot explain, and the copper price history shows a slope where supply weighs as much as the cycle.
Infrastructure demand illustrates this weight. Electrical grids, which must be extended and reinforced to absorb renewable output and vehicle charging, are among the most copper-intensive uses. Add data-center construction: the rise of artificial intelligence has revived massive investment programs, whose power and cooling demand large quantities of metal. None of these sources contracts mechanically when growth slows; some even accelerate counter-cyclically, carried by multi-year capacity commitments. Structural demand thus has its own inertia, distinct from the cycle’s.
The price also has a cost dimension. As ore grades fall and new deposits sit deeper and in more remote locations, the price needed to make fresh supply economic has risen over time, according to S&P Global. Part of what looks like a demand-driven rally is in fact the market clearing at a structurally higher cost floor. This too escapes a purely cyclical reading: a higher incentive price can persist even when current demand is soft, because it reflects the economics of bringing the next tonne to market rather than the strength of this quarter’s consumption.
Why this blurs “Doctor Copper”
The nickname “Doctor Copper” — the metal said to hold a PhD in economics for its knack at diagnosing the cycle — rests on the assumption that its demand is primarily cyclical. The recent episode tests that assumption. Copper set record after record in 2025-2026 even as its main cyclical outlet shrank: per Goldman Sachs, Chinese demand for refined copper fell by roughly 8% year-on-year in the fourth quarter of 2025, as the boost from stimulus faded. A price hitting records while its benchmark cyclical demand weakens directly illustrates the weight taken by structural and financial forces.
Copper’s signal value always rested on an implicit condition: that China, which absorbs more than half of the world’s refined metal, is its marginal cyclical buyer. As its growth model shifts from property and heavy industry toward consumption and services, the link between Chinese copper demand and the global cycle loosens. The decline in its refined demand in late 2025, alongside record prices, is one illustration: the very variable that made copper a reliable thermometer is itself changing character. Companion analysis: what iron ore captures better than copper.
A regulatory factor blurred the read further in 2025-2026. Anticipation of US tariffs on refined copper drove an inflow of metal to the United States: COMEX inventories hit records while LME European warehouses fell below 20,000 tonnes, creating a regional squeeze reflecting no new industrial demand. Part of the price therefore tracked inventory arbitrage tied to trade policy — a third source of gains foreign to the cycle, on top of the transition and mine scarcity.
Part of the market consensus nonetheless reads these records as confirmation of robust global growth. The divergence is about a mechanism, not an opinion: if a substantial share of the rise comes from electrification and constrained supply, then the price stops being a reliable proxy for the cycle, without becoming meaningless. It turns into a composite indicator blending cycle, transition and scarcity. It is also through this channel that the metal can feed cost inflation independently of demand, as examined in how copper feeds into inflation.
Doctor Copper’s past reliability rested on episodes where cyclical demand clearly drove the price, as at the major turns of 2008 or 2020. The market itself acknowledged the singularity of the current sequence: in early 2026, StoneX analysts judged the price “unsustainable” and detached from fundamentals, while Goldman Sachs still expected a small global surplus for the year. That lack of consensus on whether an immediate shortage exists confirms no clear acceleration in cyclical demand alone justified the surge — and that the metal’s diagnosis has grown more complicated.
Reading every copper record as a sign that global growth is accelerating. A growing share of demand comes from electrification and constrained mine supply, two secular forces: a high price can coexist with a flat economy, which invalidates the purely cyclical read of the metal.
What could revise this reading
Several paths remain open. Durably expensive copper stimulates secondary supply through recycling and encourages substitution by aluminum in some uses, which eventually loosens the supply constraint. The actual pace of electrification is itself uncertain: an adoption tilted toward hybrid vehicles, less copper-intensive than fully electric models, would flatten the structural-demand slope. And a vigorous Chinese stimulus could temporarily restore the lead role to cyclical demand, and with it some of the metal’s signal value. None of these variables is settled, and their evolution will decide whether the structural layer keeps the upper hand.
Conversely, too high a price carries its own brake. Market analysts note that durably expensive copper can push some manufacturers to substitute other materials in non-essential uses, eroding part of demand. This demand-destruction mechanism, like rising recycling, acts with a lag: it does not correct the imbalance overnight, but it is a reminder that no supply tension lasts indefinitely at a constant price. The path will depend on how fast these adjustments respond to the price signal.
The most cautious reading is therefore not to strip copper of all informative content, but to read it for what it has become: a price that sums a weakened cycle signal, secular transition demand and geological scarcity. Breaking it into those components, rather than reading it as a single block, remains the condition for a fair reading — and the reason the same price level can mean very different things depending on the regime behind it.
Frequently asked questions
Is copper demand cyclical or structural? Both. Part depends on the industrial and property cycle; a growing part, tied to the electrification of transport, grids and data centers, follows a secular logic independent of the business cycle.
Why is it called “Doctor Copper”? The nickname reflects the idea that copper, present in nearly every sector, diagnoses the state of the economy. That ability weakens as structural demand overtakes cyclical demand.
Does an electric vehicle contain much more copper? Yes: 83 kilograms for a battery electric vehicle against 23 for a combustion car, according to the IDTechEx study for the International Copper Association (June 2017), not counting the associated charging infrastructure.
Last updated — 7 October 2026
Disclaimer – Financial and Legal Information: The analyses, commentary, and content published on eco3min.fr are provided for informational and educational purposes only. They do not constitute investment advice or a solicitation to buy or sell financial instruments. Past performance is not indicative of future results. All investment decisions involve risk and are the sole responsibility of the reader. Data, charts and calculated series are provided as is and may contain errors or lag behind their source: check any figure against the primary source cited before relying on it. Content describing laws, regulations or contracts reflects the law as of its publication date and does not constitute legal or tax advice; applying it to a specific situation requires a qualified legal or tax professional.
Read next
Full pillar →The Copper-Gold Ratio as a Macro Signal: Still a Reliable Gauge of Treasury Yields in 2024-2026?
The copper-gold ratio pits a growth metal against a safe haven, and for years it tracked the 10-year…
Pure-play refiners versus integrated majors: downstream margin exposure
A pure-play refiner owns only the downstream, so its earnings track the refining margin. An integrated major also…
Jet fuel, the forgotten margin: the jet crack and the aviation link
The 3-2-1 crack spread reduces the refining margin to two products, gasoline and diesel. Jet fuel sits outside…