Net Rental Yield: The Detail Markets Underestimate
Net rental yield: the real metric for investing under elevated rates without being caught by inflation and operating costs.

Net rental yield: the real metric for investing under elevated rates without being caught by inflation and operating costs.
TL;DR
With French mortgage rates back around 3.5–4% at end-2025 and inflation near 2%, net rental yield — after operating costs, taxes and debt — becomes the metric that decides an investment's quality.
- On 20-year terms, rates have eased from over 4.5% in 2023 to ~3.6–3.9% at end-2025, so projects with borderline gross yield no longer clear the bar.
- Euro-area inflation has normalized to ~2–2.3%, slowing rent increases while operating costs stay sticky.
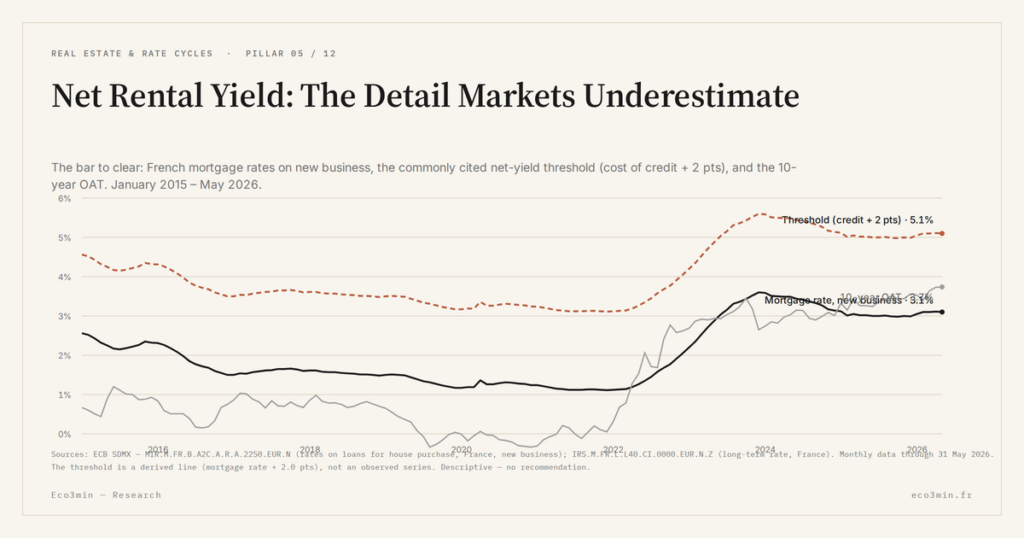
- Yields need to clear the global cost of credit by at least ~1.5–2 points; below that, the asset functions as forced savings rather than an investment.
To structure overall wealth, real return after inflation can be quantified precisely through a real return simulator, before deciding whether to overweight real estate.
Strong signals from the current environment
- Mortgage rates stabilised but still demanding: on 20-year terms, rates have come back from over 4.5% in 2023 to ≈3.6–3.9% at end-2025 → projects with borderline gross yield no longer pass.
- Inflation is normalising: around 2–2.3% in the euro area at end-2025, after the 6–7% of 2022 → rent increases are slowing, while costs (renovation works, building management) remain elevated.
- Regulatory pressure on energy performance: poorly rated dwellings face discounts of 10–20% in some major cities → some net yields rise… but at the cost of significant renovation risk.
- Tight rental market in mid-sized cities: near-zero vacancy in several secondary employment hubs → potential for net rental yield above that of saturated metropolises.
What may surprise in this situation: part of the consensus still reasons via “gross yield ≥ 5% = good deal”. Yet with structurally rising costs (building management, regulatory upgrades, local taxation), many properties at 5% gross actually fall below 2.5% net after taxes. The share net rental yield actually leaves after costs handles that side separately. The arbitrage between real estate and other asset classes shifts radically.
Decoding what current data reveal
Dominant projections suggest that the gradual decline of policy rates toward ≈2–2.5% by 2026 will provide oxygen to residential real estate. That is plausible, but analysing through net rental yield tells a different story: margin compression occurs primarily through fixed operating costs, not via rates.
Empirical observation: between 2020 and 2025, across many urban condominiums, operating costs rose by 20–30%, particularly driven by energy and maintenance. Over the same period, rents progressed only 10–15%, sometimes constrained by rent caps. As a result, the share of operating costs in collected rent has mechanically taken 3 to 5 percentage points.
Worth noting: on the macro side, normalisation of rates and inflation places 10-year sovereign bonds around 2.5–3% nominal — often above the real net rental yield of many “prime” city-centre properties. In other words, real estate is no longer the automatic safe haven. The issue is less price movement than the ability to generate positive, resilient cash flow.
This new primacy of net rental yield reflects a more structural factor than rents or operating costs alone: the regime change in mortgage credit. The deeper analysis on the mortgage credit cycle as a driver of prices shows why, in an environment where financing becomes more selective and durably more expensive, real estate performance hinges first on a project’s ability to survive without implicit subsidy from debt. The empirical detail is documented in the Eco3min study of the real estate credit cycle.
This shift in the performance criterion — from price to cash flow — fits a broader reading of real estate as a cyclical asset class, tightly dependent on rates, credit and macroeconomics. The reference page on real estate, rate cycles and the economy places net rental yield within these successive regimes, avoiding an isolated analysis that overstates the resilience of certain assets.
At the micro level, investors already rebalancing their global asset allocation are reducing positions in low-return properties to redeploy into liquid financial assets, sometimes via bond ETFs. This eases demand on the “patrimonial” segment and reinforces selectivity on pure-yield rentals.
Concrete implications: what changes now
For households and investors, the implicit rule “real estate always rises” is clearly cycle-late. Some immediate implications:
- Minimum filter: a net rental yield (after costs, before tax) of at least 2 points above the credit rate is commonly cited as a baseline. Example: a 3.8% credit rate → ≥5.8% net before tax. Below that, the project relies on hypothetical future capital appreciation.
- Compare honestly to a financial portfolio: simulating the same amount allocated to a diversified portfolio (for instance a logic close to 50/30/20 distribution) and reading real return after inflation over 10 years often produces non-intuitive results. Real estate is not always the winner.
- Watch energy renovation works: a building offering 6.5% gross but requiring ≈€400/m² of energy retrofitting can see its net yield fall to 3–3.5% over 10 years. This scenario assumes public subsidies remain stable, which is not guaranteed.
- Think position sizing: for a total financial wealth of €100,000, committing €80,000 of equity to a single property concentrates rental risk heavily. A more balanced allocation around 50% real estate / 40% financial assets / 10% liquidity is often more robust.
Counter-argument worth keeping in mind: if banks loosen credit conditions faster than expected, a demand inflow could revive prices in some tight markets and offset weak net yield through capital appreciation. But this is not the central scenario for now.
Weak signals to monitor
- Spread between net rental yield and 10-year French sovereigns (OAT): if, in a major city, average net yield on residential falls below +1 point versus the OAT, the arbitrage toward financial assets becomes evident.
- Rental vacancy rate: a shift from 2% to 5% average vacancy in a district can erase 0.5 to 1 point of net yield. Local statistics — or, failing that, agency re-letting timelines — provide a useful proxy.
- Property tax trajectory: in some metropolises, taxes jumped 20–30% between 2022 and 2025. If the trend persists, it directly erodes cash flow without the option to fully pass through to rent.
- Renovation cost per square metre: persistently high labour costs despite material price normalisation reduce the speculative appeal of “fixer-upper” properties.
- Flows into listed real estate ETFs: heavy inflows over a few weeks may signal renewed sector appetite… or a technical rebound without long-term support, to be weighed against the investment horizon.
Plausible medium-term scenarios
Scenario 1 — Soft landing (central): mortgage rates decline slightly further toward ≈3.2–3.5% within 12 months, prices stabilise, rents rise 2% per year. In this configuration, net rental yield becomes acceptable but not spectacular: well-positioned assets offer 4–5% net before tax. The same chain plays out in listed property: our analysis of REIT distribution and risk. The market does not fully price the fact that only properties genuinely well-positioned on the rental market will perform.
Scenario 2 — Increased polarisation: some areas (dynamic mid-sized cities, well-served peripheries) see net yields climb to 6–7% on still-discounted prices, while prime city centres stagnate at 2–3% net. Geographically mobile investors capture the spread; others bear the stagnation.
Scenario 3 — Regulatory shock: rapid tightening of energy standards or new taxation on rental income compresses net yields abruptly. This is not the dominant scenario today, but it is a less visible risk than others — therefore easier to ignore. Read through net yield rather than the headline number, that regulatory risk belongs to rental returns traced from gross yield down to net. Key indicator to follow: tax announcements and mandatory renovation timelines.
In every case, tracking real return (after tax and inflation) with a financial tool preserves a global view and prevents real estate from cannibalising total capital.
Three key takeaways
- Net rental yield exceeding the global cost of credit by at least 2 points is commonly viewed as the threshold justifying the specific risk and illiquidity of real estate.
- Operating costs, taxes and energy renovation works erode margins more than rates in 2025: ignoring these line items effectively means overpaying for an asset without realising it.
- Balanced wealth retains real estate as a pillar but rarely as the sole strategy: 40–60% maximum exposure remains a commonly observed range depending on profile.
We’ll revisit tomorrow with a possibly different market backdrop.
Key points
- A property at 5% gross can fall below 2.5% net rental yield after costs and taxes: the real investment filter is no longer price per square metre but actual cash flow.
- With mortgage rates around 3.5–4%, achieving at least 1.5–2 points of net yield above the cost of debt has become the new line of defence for investors.
- Rental market polarisation is accelerating: dynamic mid-sized cities and well-connected districts offer more upside than overpriced city centres.
Last updated — 25 July 2026
Disclaimer – Financial Information: The analyses, commentary, and content published on eco3min.fr are provided for informational and educational purposes only. They do not constitute investment advice or a solicitation to buy or sell financial instruments. Past performance is not indicative of future results. All investment decisions involve risk and are the sole responsibility of the reader.
Read next
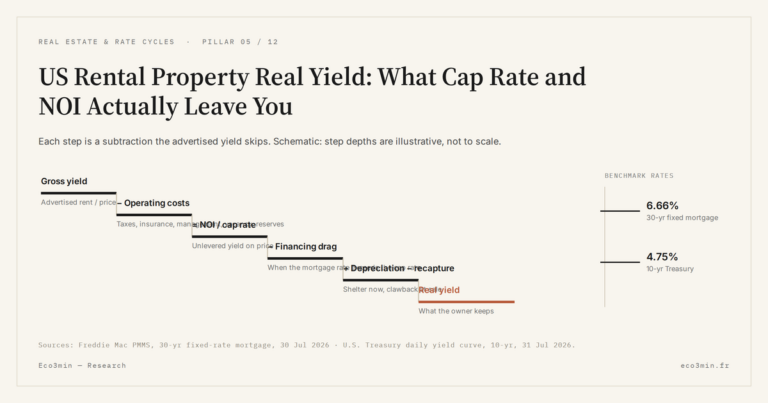
Full pillar →US Rental Property Real Yield: What Cap Rate and NOI Actually Leave You
A rental listing leads with a yield. Divide the annual rent by the price and the number looks…
Cap Rate Spread: What Rental Yield Pays Over the 10-Year Treasury
A 5% cap rate sounds attractive. But 5% against what? A risk-free 10-year Treasury yields near 4.5% in…
US Rental NOI, Line by Line: What Net Operating Income Really Subtracts
A US rental yield is advertised gross: annual rent over price. Between that number and the income an…