
Nickel Demand: Stainless Steel, Batteries and the Two-Tier Market

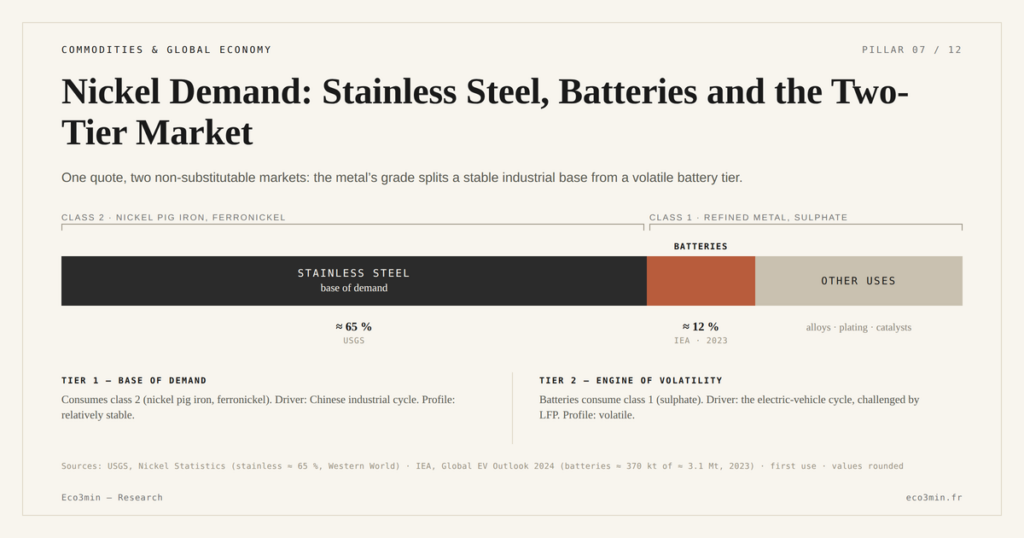
Nickel demand is not a single block but a two-tier market: stainless steel, which absorbs close to two-thirds of it, and batteries, a newer and more volatile segment. Grasping this split is the key to reading any move in the metal’s price.
TL;DR
Even within stainless steel, close to two-thirds of nickel demand, mills swing between nickel-bearing 300-series and leaner 200-series grades, so the metal intensity of demand itself flexes with price.
- Stainless steel takes close to two-thirds of nickel as class 2, geared to the Chinese industrial cycle and relatively stable, while the smaller battery tier, tied to the EV cycle and challenged by LFP, carries the volatility.
- Cell manufacturing still sits mostly in China and Asia, but capacity built in Europe and North America under industrial-policy pressure shapes which nickel, sourced under which rules, batteries will draw on.
Mapping nickel demand — its two uses, their distinct grades and their separate drivers — provides the baseline grid without which a price move stays illegible. Each tier obeys a different logic.
1. A two-tier market: class 2 and class 1
The first habit to acquire is to stop speaking of nickel in the singular. The metal comes in two main grades, poorly substitutable, matching two uses and two distinct supply chains. Class 2 groups the lightly refined products — nickel pig iron and ferronickel — destined for stainless steel. Class 1 denotes the high-purity metal, refinable into sulphate, indispensable to batteries and certain specialised uses. The two grades are not equivalent and do not trade interchangeably: you do not make a battery from pig iron, nor cheap stainless steel from costly refined metal.
This split has a decisive consequence for analysis. A surplus in one tier does not mechanically relieve a tension in the other. A well-supplied stainless-steel market can coexist with a tight battery segment, and vice versa, without the two offsetting. It is precisely this segmentation that makes nickel a market hard to read through a single quoted price: behind the one headline figure lie two dynamics that do not beat to the same rhythm.
2. Stainless steel, the historical base of demand
The first tier, and by far the larger, is stainless steel. It alone absorbs close to two-thirds of world nickel consumption, to which the metal lends its corrosion resistance. This demand is consumed as class 2, that is, nickel pig iron and ferronickel, products relatively cheap to incorporate into steel. The base of nickel demand is therefore, above all, ordinary industrial demand, geared to capital goods, construction and household uses of stainless steel.
This base is heavily concentrated geographically. China dominates both the production and the consumption of stainless steel, which ties a large share of nickel demand to the Chinese industrial and property cycle. A slowdown in Chinese construction or manufacturing thus bears directly on the market’s most important tier. That dependence adds a concentration on the demand side mirroring the concentration on the supply side. To place this weight in the wider frame of growth cycles, it can be set against Chinese commodity demand.
Even within stainless steel, not all grades use the same nickel. The nickel-bearing 300-series carries a substantial nickel content, while lower-nickel 200-series grades substitute manganese for part of it. When mills shift their product mix toward cheaper, lower-nickel grades, as they tend to when nickel is expensive, the metal intensity of stainless demand itself falls. The stainless tier is therefore not a fixed call on nickel either: its appetite flexes with both volume and grade mix, adding a second, quieter source of variation to the larger of the two tiers.
The advantage of this base is its relative stability: stainless steel follows, more or less, ordinary economic cycles, without outsized jolts. On its own, it would not make nickel an exceptionally unstable market. It is the addition of a second, more volatile tier that transforms the metal’s risk profile. Class 2 pig iron is, moreover, largely drawn from Indonesian nickel supply, whose rise first targeted this outlet before extending to the battery segment.
Alongside these two main tiers, class 1 also serves quieter uses it would be wrong to ignore. Refined nickel goes into plating, into superalloys for aerospace and energy, and into various special alloys. These outlets weigh only a fraction of the total, but they draw on the same grade of metal as batteries and therefore compete with them for class 1. Refined-nickel demand is thus not a perfect synonym for battery demand: part of it is captured by demanding industrial uses whose own dynamic adds to that of electric vehicles.
3. The battery segment, engine of growth and volatility
The second tier is batteries, smaller in volume but far more dynamic. It consumes class 1 nickel, refined into sulphate, which goes into the cathodes of lithium-ion batteries. Through the 2020s, as electric-vehicle adoption accelerated, this demand became a new driver of the price, layered on top of historical stainless-steel demand. Its defining feature is to track the electric-vehicle cycle, itself sensitive to subsidies, interest rates and technological shifts, hence far more volatile than steady industrial production.
This segment also carries its own technological uncertainty. Not all batteries contain nickel: lithium-iron-phosphate chemistries, known as LFP, do without it, and their rise on entry and mid-range segments cuts class 1 demand accordingly. The trajectory of the battery tier therefore depends not only on the pace of electrification, but also on a trade-off between cathode families. The detailed analysis of this machinery, from chemistry to the purity constraint, is carried out in the battery segment and NMC cathodes.
The battery segment’s weight in price formation exceeds its share of volume. Even when a minority of total consumption, it has often been the marginal outlet, the one whose swings set the market’s direction at a given moment, because it carried the strongest growth expectations. A disappointment on electric vehicles therefore weighs on the price well beyond the tonnage involved, because it invalidates the future-shortage narrative on which part of supply had been sized. This is why a segment that accounts for only a fraction of volume can bear heavily on the headline quote.
The geography of that battery demand is shifting too. Most cell manufacturing still sits in China and the rest of Asia, but capacity is being built in Europe and North America under industrial-policy pressure. Where the cells are made shapes which nickel, sourced under which rules, the segment will draw on — adding a political layer to a demand already driven by chemistry and the vehicle cycle.
4. Why the two tiers do not substitute, and how to read a price
The boundary between the two grades was long thought watertight, and it is this partial watertightness that makes the market awkward to read. Converting abundant class 2 into class 1 usable for batteries requires costly industrial processes, such as turning pig iron into matte and then sulphate. The announcement of such a process in 2021 was indeed enough to send prices tumbling, precisely because it raised the prospect of a bridge between the two tiers. But that bridge remains partial: in practice, a surplus of pig iron destined for stainless steel does not pour instantly onto the battery-sulphate market.
That separation is reflected even in market visibility. The inventories recorded by the London Metal Exchange concern class 1 metal, deliverable against the quoted contract; class 2 pig iron, traded largely over the counter and tied to Indonesian flows, partly escapes that count. An observer following only exchange inventories could therefore overstate tension on one side of the market while missing abundance on the other. The uneven transparency of the two tiers further complicates the diagnosis and is a reminder that no single figure sums up the state of nickel demand. Related coverage: After Nickel: The LME, the 2022 Cancellation and a Metals Exchange’s Credibility.
The practical consequence is that a nickel price move must always be referred to the tier it comes from. A spike driven by an anticipated class 1 shortage for batteries does not mean the same thing as a tension from a pickup in Chinese stainless-steel demand. Likewise, a collapse may reflect an oversupply of Indonesian class 2 without the battery segment being eased at all. Reading nickel through its headline quote alone, without distinguishing the two tiers, leads to conflating signals that share neither cause nor reach — a confusion that feeds directly into nickel’s structural instability.
Nickel demand is often equated with the battery and electric-vehicle story alone. That overlooks the fact that two-thirds of consumption still comes from stainless steel, largely tied to the Chinese industrial cycle. A price move attributed to batteries sometimes comes, in reality, from the stainless tier — and vice versa.
- Nickel demand splits between stainless steel, which absorbs close to two-thirds of it as class 2, and batteries, which require refined class 1.
- The stainless base, concentrated on the Chinese industrial cycle, is relatively stable; the battery segment, tethered to the electric-vehicle cycle and challenged by LFP, brings the volatility.
- The two tiers do not substitute freely: reading a price move requires identifying which segment it comes from.
Conclusion
Mapping nickel demand into two distinct tiers is no academic refinement: it is the condition for correctly interpreting a market its single quote makes misleading. The stable stainless-steel base and the volatile battery engine coexist without merging, each with its grade, its supply chain and its cycle. This grid, which belongs to the geoeconomics of resources, must always precede the interpretation of a price move: the first question is not how much nickel moved, but which of its two markets moved.
Last updated — 12 July 2026
Disclaimer – Financial Information: The analyses, commentary, and content published on eco3min.fr are provided for informational and educational purposes only. They do not constitute investment advice or a solicitation to buy or sell financial instruments. Past performance is not indicative of future results. All investment decisions involve risk and are the sole responsibility of the reader.
Read next
Full pillar →Reading the refinery utilisation rate: the threshold, the season, the turnarounds
A refinery runs full near ninety percent, not a hundred: the last slice of nameplate capacity is a…
IMO 2020: the regulatory shock that rewrote product spreads
An environmental rule on marine sulfur can move a refining spread more than a swing in crude. IMO…
The 2022–2023 refining golden age: anatomy of an episode
In 2022, refined fuel prices climbed faster than crude. That gap, measured by the 3-2-1 crack spread, reached…


