
Cocoa’s 2024-2026 Round-Trip: Anatomy of a Record Boom-Bust and the Fragility of Concentrated Soft Markets

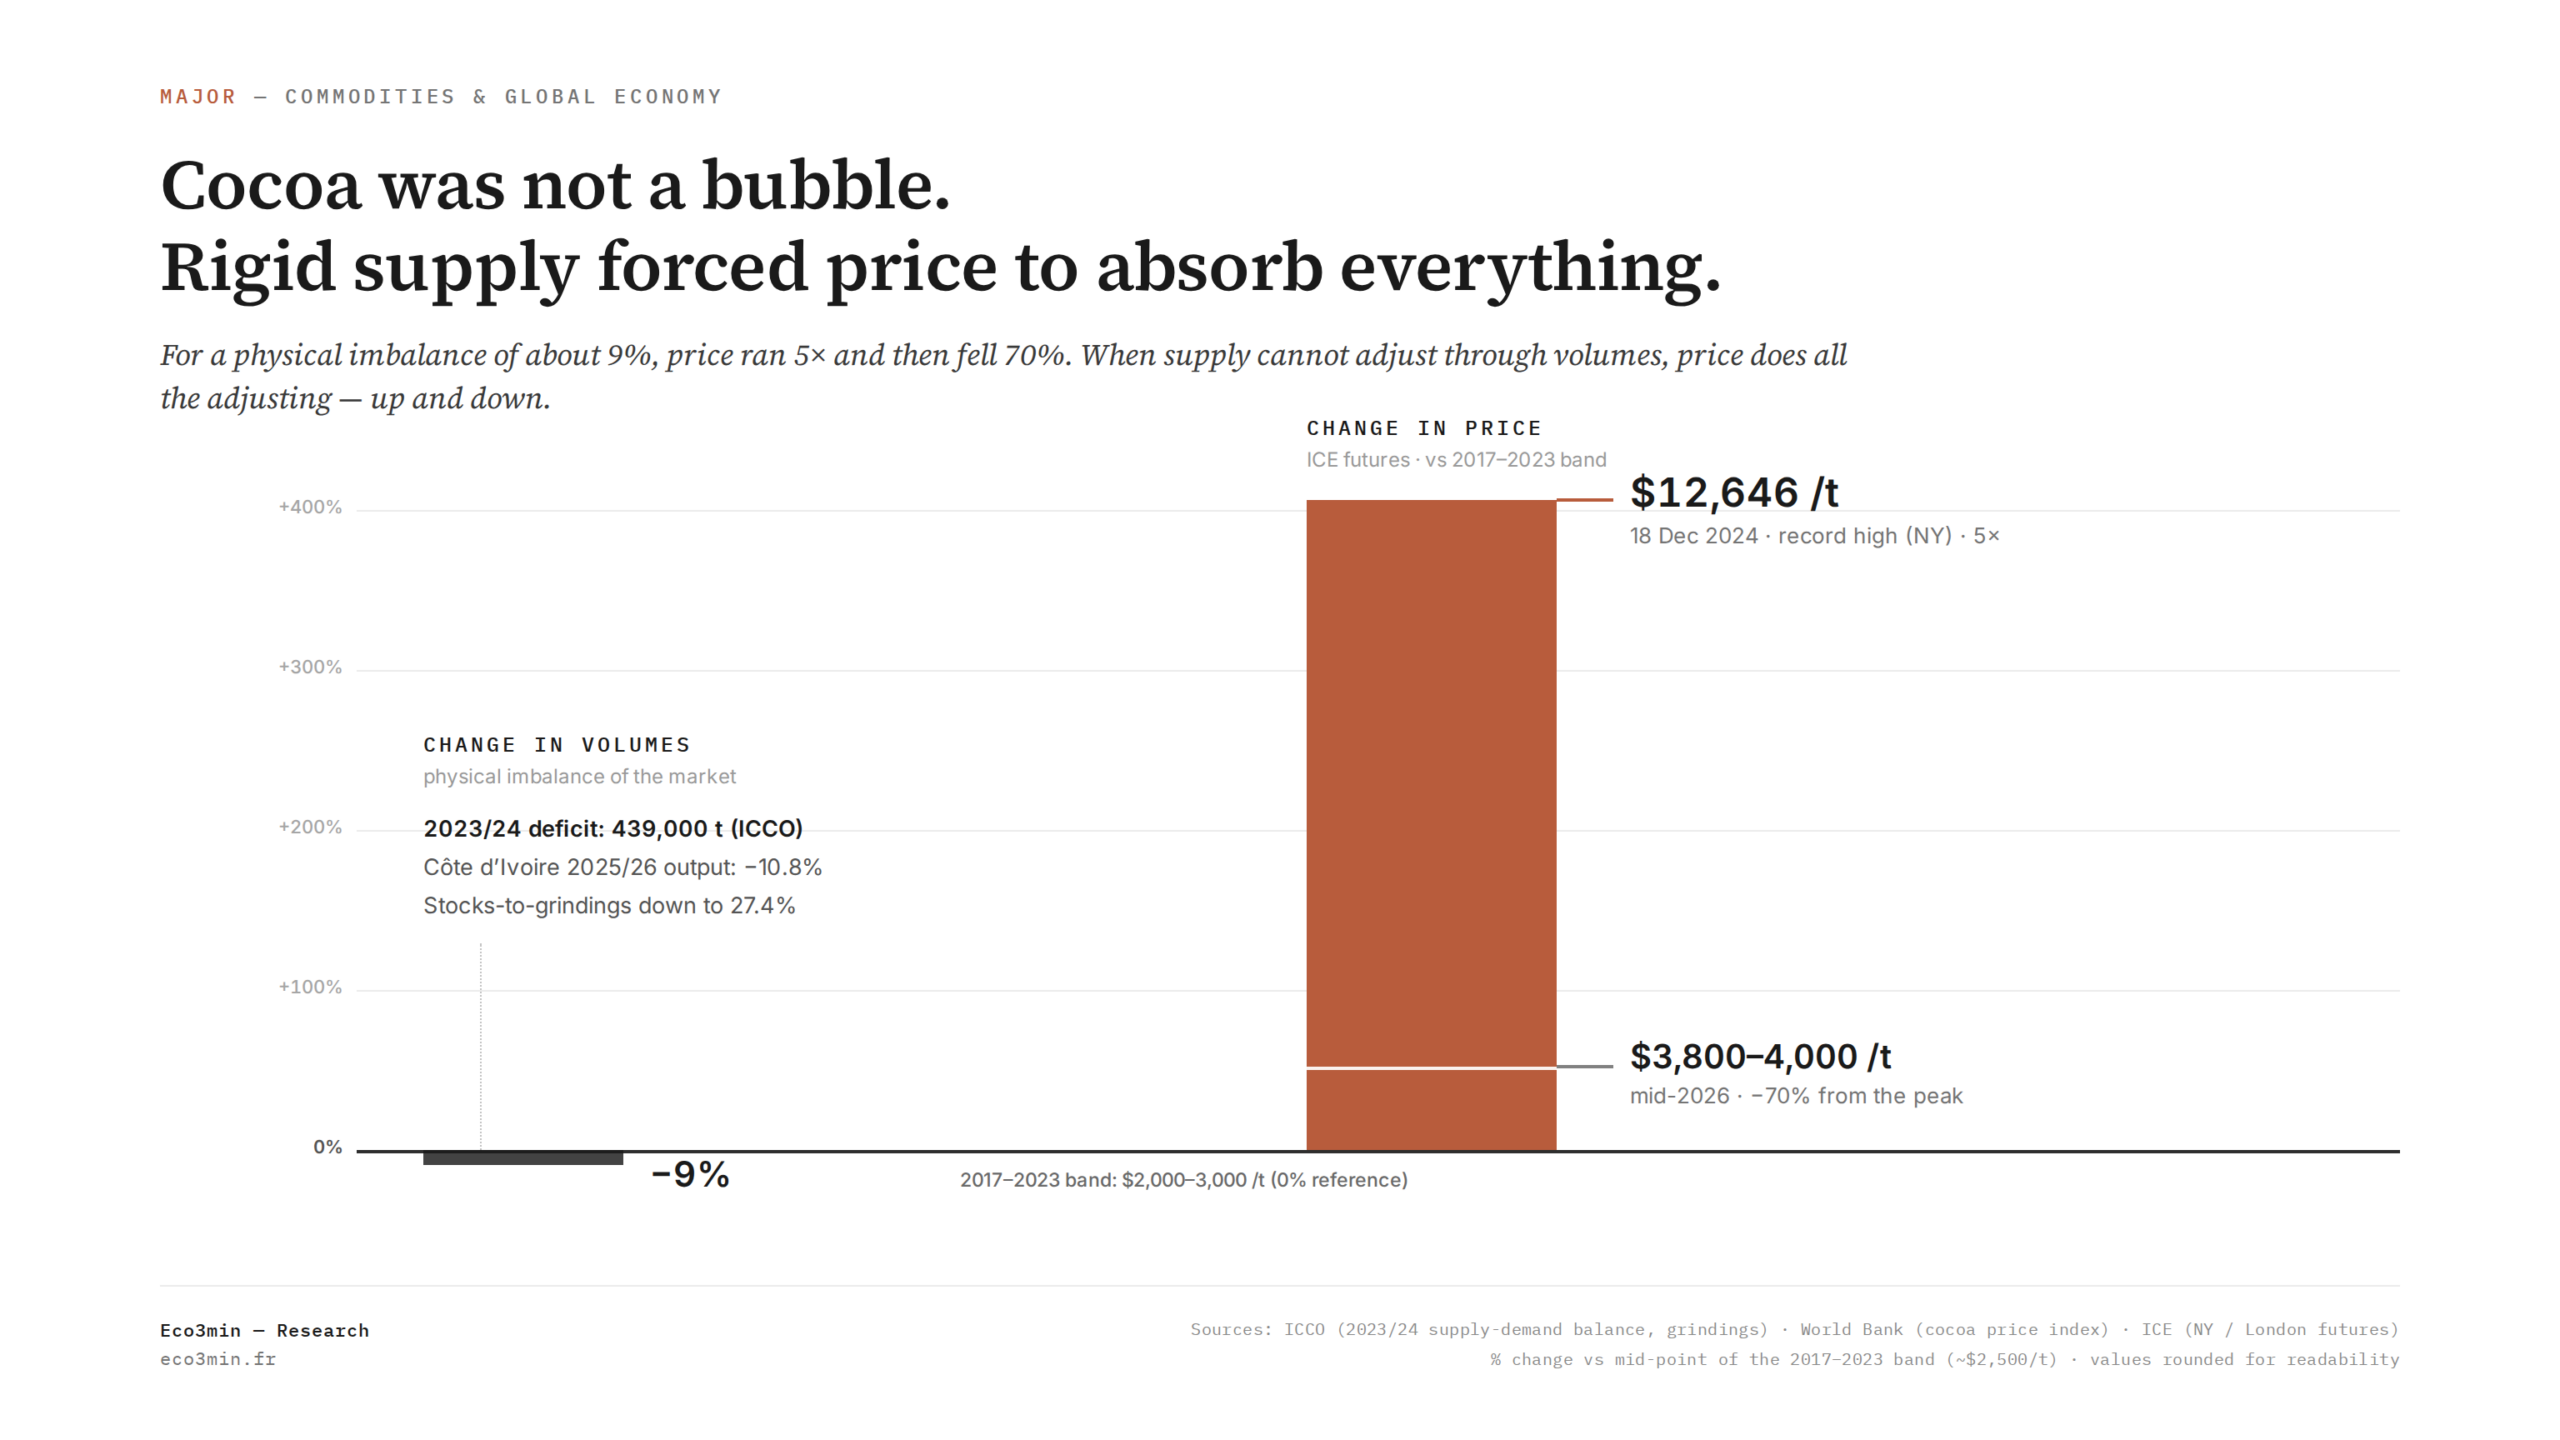
Between late 2024 and mid-2026, cocoa multiplied more than fivefold and then surrendered nearly 70% of its value. This round-trip is not the story of an isolated market excess, but of the fragility of a physical supply that is geographically concentrated and unable to respond quickly.
TL;DR
Cocoa multiplied more than fivefold from late 2024 then shed nearly 70% by mid-2026, one of the most violent round-trips in recent commodity history, driven by rigid, concentrated supply.
- The New York contract reached $12,646 per tonne on 18 December 2024, an all-time high, after London peaked at $11,530 on 13 June; at the top the bean briefly traded richer than copper.
- The International Cocoa Organization's May 2024 balance put 2023/24 output at 4.461 million tonnes against 4.855 million tonnes of grindings, a 439,000-tonne deficit, with the stocks-to-grindings ratio down to 27.4%.
- The descent was largely a 2025 phenomenon: price fell below $8,000 by March 2025 and closed near $6,066 in December, before stabilising around $3,800 to $4,000 by mid-2026.
- Financial flows followed fundamentals rather than leading them; the Financial Times reported hedge funds had poured close to $8.7 billion into the futures markets, while margin calls forced commercial hedgers to buy back shorts and amplify the climb.
The angle taken here moves past the news cycle toward structure: what the episode reveals about an agricultural market with rigid supply, and why price had to absorb the entire adjustment on its own.
In February 2024, cocoa cleared a level the market had treated as untouchable for almost half a century: the 1977 record of $5,104 per tonne. Months later, on 13 June 2024, the London index peaked at $11,530, and on 18 December 2024 the New York contract reached $12,646 per tonne, an all-time high. Published in the World Bank commodity price data. At that level, the bean briefly traded richer than copper. Then the move reversed: falling below $8,000 as early as March 2025, cocoa slid through the year to close near $6,066 at the end of December 2025, before stabilising around $3,800 to $4,000 by mid-2026 — roughly 70% below the peak, after touching a low near $2,850 earlier in the year. Taken separately, each of these two moves looks like a frenzy. Together, they trace one of the most violent round-trips in the recent history of commodities.
The dominant reading sees an ordinary cycle amplified by speculation. Another reading is available, and it is the one this analysis defends: the episode is the signature of a market whose physical supply is concentrated at close to 70% in West Africa, where a tree takes years to bear fruit and where a yield shock cannot be offset quickly. When supply is this rigid and this concentrated, it falls to price to do all the adjusting — violently, in both directions. The rest of this study works back from the symptoms to that structural cause, then hands each mechanism to a dedicated analysis.
1. The backdrop: a market that sat in a narrow band
Before the anomaly can be understood, the normal must be described. Between 2017 and mid-2023, cocoa traded in a remarkably stable band, largely between $2,000 and $3,000 per tonne. In 2023, the London average still hovered around $3,182. On that basis, growers, processors and chocolate makers could work with predictable cost structures: the bean was neither a volatile asset nor a subject for the financial press. For six years, the cocoa market was, quite literally, boring — and that boredom was the expression of a supply-demand balance with no apparent strain.
That stability rested on a particular geography. Two countries — Côte d’Ivoire and Ghana — supply more than 60% of world output on their own, and West Africa as a whole, adding Nigeria and Cameroon, accounts for close to 70%. The remainder is split between Ecuador, Brazil, Indonesia and a handful of marginal producers. This concentration is not neutral, and we will return to it at length: as long as West African harvests are normal, it guarantees steady supply; the moment they falter, there is no substitute production basin able to step in within a single season. Unlike the major grain crops, cocoa has no dual hemisphere in which a good southern harvest can offset a poor northern one. For context: the role of surges over levels.
A second feature shapes this market: the world price is not set in the plantations, but on two futures markets operated by ICE, in London and New York. The bean harvested in Côte d’Ivoire follows a long chain — fermentation and drying at the farm, purchase by intermediaries, export, processing into liquor, butter and powder — but the benchmark price signal is set continuously on those two venues. London historically prices West African grades, New York a more global reference, and the spread between the two contracts itself reveals regional supply tensions. The International Cocoa Organization publishes a daily price built as the average of the three nearest active contracts on London and New York, converted into dollars. Grasping this separation between the physical site of production and the financial site of price formation is the precondition for any reading of the round-trip: it is precisely what our analysis of where the bean price forms sets out, and what places cocoa within the wider family of physical commodity markets.
Quality differentiation adds a further layer that a single headline price conceals. Cocoa is not a homogeneous commodity: West African bulk beans, which dominate the futures contracts, trade differently from the fine and flavour cocoas of parts of Latin America and the Caribbean, and the spread between origins reflects both quality and availability. The London and New York contracts price the bulk grades; premiums and discounts for specific origins move around them. During the 2024 squeeze, those differentials widened as buyers competed for compliant, deliverable beans, and they compressed again as supply returned. The headline price tells the broad story; the structure of origin differentials tells where, within the market, the tension is most acute. Worth reading alongside: Cocoa Futures: ICE, Certified Stocks and Financialization.
Administered prices complete the backdrop. In both Côte d’Ivoire and Ghana, the price paid to the farmer is not the world price but a farmgate price set by a public body — the Conseil du Café-Cacao on one side, Cocobod on the other — often fixed ahead of the season. This mechanism partly insulates the grower’s income from international volatility, but it also introduces a lag: when the world price soars, the farmer captures only a delayed fraction of it, which creates cross-border incentives we examine elsewhere in this study. For now, the point to hold is that the cocoa price forms at three distinct levels — administered farmgate, export, futures — and that these levels move neither at the same speed nor with the same amplitude.
On the demand side, finally, cocoa occupies an asymmetric position: it is grown almost exclusively in the tropical belt but consumed mainly in the global North, which accounts for the bulk of world chocolate sales. This separation between producing and consuming regions amplifies the sensitivity of price to decisions taken in two West African capitals, and explains why a local shock becomes an immediate cost shock for the global chocolate industry. Demand itself is held to be relatively price-inelastic in the short run: chocolate is a small pleasure whose consumption adjusts only slowly to price — up to the point where, as the rise becomes unsustainable, manufacturers reformulate and shrink. This short-run inelasticity, on both the supply and demand sides, is the key to everything that follows.
The downstream end of the chain adds its own concentration. A handful of large international processors and chocolate makers dominate grinding and manufacturing, which gives them bargaining power against millions of dispersed smallholders. This asymmetry shapes how value is shared along the chain: when the world price soars, most of the gain lodges in the intermediary and financial links, not with the grower, whose income stays anchored to the administered farmgate price. This structure is not merely a question of fairness; it explains why a record world price does not mechanically trigger the wave of investment and replanting that would rebalance supply.
The stability of 2017-2023 in fact masked a rising fragility. Part of the West African orchard was ageing, yields were slowly declining under soil exhaustion and disease pressure, and investment in replanting remained insufficient relative to need. The low price of the period, by squeezing growers’ incomes, discouraged precisely the spending that might have pre-empted the supply shock. The 2024 surge therefore did not come out of nowhere: it revealed a vulnerability accumulated over years of prices too low to properly maintain the productive base.
2. The 2024 ascent: how a deficit became a record
The shift did not begin with speculation, but with a measurable physical imbalance. The supply-demand balance published by the International Cocoa Organization in May 2024 put 2023/24 production at 4.461 million tonnes, against grindings — industrial processing, the proxy for demand — estimated at 4.855 million tonnes. The gap, a deficit of 439,000 tonnes, was no trifle in a market that leans this heavily on two suppliers. The stocks-to-grindings ratio fell at the same time to 27.4%, a level that signals genuine strain on physical availability: less than a quarter of a year of cover, for a product whose supply cannot be rebuilt in a matter of months.
That deficit itself stemmed from successively disappointing West African harvests. Drought episodes tied to El Niño, excessive rainfall favourable to fungal disease, and above all the spread of swollen shoot virus — a viral disease that durably degrades cocoa trees and eventually forces uprooting and replanting — had weighed on yields across several seasons. These factors are the physical trigger of the surge, and we examine them in detail in our analysis of climate and disease yield shocks. Added to this were regulatory uncertainties, notably around the European Union’s deforestation regulation, which raised fears that compliant supply would become scarcer and that flows would be reshuffled around new traceability requirements.
The very shape of the forward curve betrayed the scarcity. The cocoa market moved into pronounced backwardation — that is, near-dated contracts traded markedly richer than far-dated ones, the classic signature of strain on immediate availability. This configuration rewards holding physical beans and encourages destocking, which can tighten the near-term market further still. It also sends a signal to financial players: on a market in backwardation, simply rolling a long position from one contract to the next generates a return, which helped draw additional capital toward the bean.
The profile of speculative positioning deserves to be spelled out, because it qualifies the “bubble” narrative. The inflow of capital was not a constant, one-way bet: it accompanied the deterioration of fundamentals, intensified as supply fears were confirmed, then reversed once harvest prospects improved. In other words, financial flows largely followed fundamentals rather than leading them — which does not absolve them of having amplified the amplitude, but rules out treating them as the first cause of the move.
The price path then tracked supply anxiety. In February 2024, cocoa went through the 1977 record like a hot knife through butter. By April it had passed $11,700, paused, then resumed. When the New York contract cleared $10,000 in the first quarter, procurement conversations across the industry had already changed in nature: the question was no longer the acquisition price, but the physical security of supply — was the necessary cover in place, and what would happen if the rise continued. Prices kept climbing to the two peaks of the year: $11,530 in London on 13 June, $12,646 in New York on 18 December, after a partial summer pullback and a violent year-end rebound.
A market mechanism, largely invisible to the public, accelerated the upward spiral: margin calls. On futures markets, a trader who sells cocoa to hedge a physical purchase must post collateral, marked to market daily against the price. When the price rises this fast, the unrealised losses on short hedging positions trigger large margin calls. Some commercial players, lacking the cash to meet them, had to unwind their hedges — that is, buy back their short positions, which adds buying demand and pushes the price still higher. This loop, in which the rise feeds the rise by driving the natural sellers out of the market, illustrates how financial mechanics can amplify a physical shock well beyond what fundamentals alone would justify.
Financialisation in the narrow sense did the rest, without being the first cause. The Financial Times reported as early as 2024 that hedge funds had poured close to $8.7 billion into the London and New York futures markets, adding upward pressure to an already strained market. The point bears holding firmly: speculation grafted itself onto stretched fundamentals; it did not invent them. The distinction between physical fundamentals and market mechanics is central to our study of West African supply concentration, which shows why, on this particular market, a production shock turns almost mechanically into a global price shock.
The scale of the number deserves to be measured. From December 2023 to December 2024, on the World Bank’s monthly series, the price of cocoa rose by 145% (from $4,254 to $10,412 a tonne), and by 127% on an annual-average basis; the New York contract did even more over the calendar year. No other major commodity had seen such an acceleration over the period. At its highest — and this is the detail that struck commentators — the bean traded richer than copper, an industrial metal whose market capitalisation and traded volumes dwarf cocoa’s. This temporary reversal of hierarchy captures the anomaly on its own: a niche agricultural product was worth, for the space of a few weeks, more than a base metal at the heart of the global economy. Some analysts then expected high prices to persist; certain houses cited a medium-term level around $6,000 per tonne for the following season. Reality would again surprise by its amplitude.
Clearing the 1977 record deserved a pause on its own. That high dated from the great commodity boom of the 1970s, a decade of repeated supply shocks and elevated inflation during which cocoa had already seen a spectacular spike before falling back. For nearly fifty years, no imbalance had been acute enough to threaten it. That 2024 not only matched but more than doubled it speaks to the severity of the deficit: this was not a strain comparable to the intermediate cycles of the 1980s, 2000s or 2010s, but an event of another order, in which physical scarcity reached a degree the modern market had never experienced. The 1977 precedent also reminds us that such peaks, however extreme, always eventually resolve — as the sequel confirmed.
3. The reversal: the 2025 descent and the 2026 stabilisation
The December 2024 peak marked the end of the ascent, not the immediate start of a spectacular collapse. The correction stretched across the whole of 2025, and this is a point many retrospective accounts distort by compressing the collapse into 2026. Prices fell below $8,000 as early as March 2025, slid toward the $6,000-$7,000 band over the summer, then continued lower into the autumn to close the year around $6,066 at the end of December 2025. The downward leg is therefore, in essence, a 2025 phenomenon. 2026 corresponds more to a trough and a stabilisation: by mid-2026, cocoa traded around $3,800 to $4,000 per tonne on ICE in New York, after touching a low near $2,850 earlier in the year. Over twelve months, the fall reached roughly 61%, and close to 70% from the December 2024 peak. The dating matters: mistaking the 2025 leg for a 2026 crash leads to a misreading of what caused the reversal.
Update, September 2026: the trough did not hold. After a $3,241 monthly average in March 2026, the ICCO daily price carried by the World Bank climbed back to $4,395 in June and $5,619 in July 2026, 73% above the low and still 48% below the January 2025 monthly peak ($10,710). The International Cocoa Organization also revised the 2023/24 deficit to 489,000 tonnes in November 2025 and puts 2024/25 at a 49,000-tonne surplus. The stabilisation described above was a step, not a floor.
Two forces converged to produce that reversal. On the supply side, harvests began to rebuild, helped by milder weather in West Africa. Côte d’Ivoire was guiding toward 2025/26 production down 10.8% at 1.65 million tonnes, but its port arrivals told another story: between 1 October 2025 and 28 June 2026, volumes delivered to ports reached 1.91 million tonnes on exporters’ estimates, up 18% year on year, and passed 2 million tonnes in early July. Certified stocks monitored by ICE rose in parallel toward their highest level in roughly one and three-quarter years. The market was tipping from deficit toward an expected surplus, and upwardly revised harvest expectations were enough to flip the price dynamic.
Weather expectations played their part in the timing. A milder, drier Harmattan and more favourable rainfall across the 2025/26 main crop eased fears that had driven the late-2024 spike, and improved crop forecasts fed directly into prices well before the physical beans arrived. This is characteristic of the market: because supply cannot adjust, expectations about the coming harvest do much of the near-term price work, and they move by abrupt revision rather than gradual drift. A single reassuring forecast can shift the price more than a confirmed tonnage, precisely because the market is pricing a future it cannot yet verify.
On the demand side, the high price had finally destroyed part of its own consumption. World grindings, the most direct measure of industrial demand, fell from 4.81 million tonnes in 2023/24 to 4.60 million tonnes in 2024/25, according to the International Cocoa Organization’s November 2025 bulletin. Behind that aggregate figure, chocolate manufacturers had pulled every available lever: smaller formats, lower cocoa content, partial substitution with other ingredients, higher selling prices. This demand destruction, combined with returning supply, broke the balance of power. We analyse this industrial behaviour and its asymmetry on the retail side in detail in our study of price transmission from bean to shelf. A related read: Cocoa Demand Destruction, Chocolate Reformulation and Retail Prices.
The retreat in demand was not evenly distributed. Grindings fell more in Europe and North America, mature markets where higher retail prices weighed most on volumes, while Asia held up better. This geography of demand destruction matters, because it conditions the speed at which consumption can recover: a mature market that has shrunk its bars and lowered cocoa content does not spontaneously reverse the moment the price falls. Part of the lost demand may be lost durably, which shifts the market’s equilibrium path.
The economics of reformulation sharpen this point. Faced with beans at $10,000, manufacturers substituted other ingredients, cut grammages and revised recipes — decisions costly to implement, but also costly to undo. Once a production line has been reconfigured and a consumer has grown used to a smaller format, a return to the previous formula is anything but automatic. The cocoa surge may thus have set off a structural decline in the cocoa intensity of global consumption, independent of the price level. This is one of the ways a price shock leaves an imprint that outlives it.
The shock also compressed downstream margins. Caught between a bean above $10,000 and retailers reluctant to pass the full rise through, processors and chocolate makers saw their profitability squeezed. Not all were hedged alike: those that had locked in forward supply before the surge came through largely unscathed, while less-hedged players absorbed the shock in their accounts. This dispersion explains why the surge did not hit the industry uniformly, and why the 2025-2026 decline did not mechanically restore margins either: hedges struck at the highs keep weighing as long as they run. The gap between the spot price and the cost actually borne by manufacturers is a further reminder that the figure on the screen does not, on its own, tell you what the chain pays.
A market factor sharpened the fall: the withdrawal of financial participants. Part of the funds that had fed the rise left the market to avoid the risk of extreme swings, reducing liquidity and amplifying moves in both directions. The same margin-call mechanism that had fuelled the rise now worked in reverse: the rapid decline penalised long positions, forcing some to liquidate, which accelerated the retreat. The paradox of a thin market is that this amplification works both ways.
The pace of any demand recovery deserves emphasis, because it shapes the market’s path from here. Grindings do not snap back the moment the bean cheapens. A manufacturer that has resized formats, reworked recipes and renegotiated supply contracts will not reverse those changes on the strength of one good harvest; it will wait for confidence that lower prices are durable, and even then some of the lost cocoa intensity may never return. The supply side, for its part, recovers on the tree’s calendar, not the market’s. The result is a market that can swing from deficit to surplus faster than either consumption or production fully adjusts — which is precisely why the price, caught between two slow-moving real quantities, does the violent work in between.
To these factors is added a distortion specific to cocoa: the divergence of administered farmgate prices between Côte d’Ivoire and Ghana. When the two farmgate prices diverge, beans cross the border toward the country that pays more, through informal channels, which distorts official harvest statistics and complicates the reading of the market. This mechanism, which we set out through the farmgate price differential and the smuggling it feeds, was at work throughout the period. For readers who want to follow the market’s full numerical path over the long run and place the amplitude of the episode against past cycles, a complete monthly series since 1992 is available on the dedicated dataset page.
It is often assumed that a falling bean price automatically pulls down the price of chocolate on the shelf. It does not: cocoa is a limited share of a bar’s cost, manufacturers buy forward months in advance, and retail prices are sticky on the way down. Transmission from cocoa to chocolate is slow and incomplete — on the way up as on the way down.
4. Why this is not an ordinary cycle: the fragility of rigid, concentrated supply
An ordinary commodity cycle self-corrects: a high price draws in additional production capacity, supply rises, and the price comes back down. For cocoa, that corrective mechanism is gravely impaired by two structural properties which, combined, turn every imbalance into an outsized price move.
The first is geographic concentration. Where oil has dozens of production basins across every continent, where copper is mined from Chile to Peru to the Democratic Republic of Congo, cocoa depends for close to 70% on a single region of the world. That dependence offers no cushion: a drought, a disease or a political decision in Côte d’Ivoire and Ghana feeds directly into the price paid everywhere else, with no other zone able to absorb the shock. What other markets dissolve in the diversity of their sources, cocoa concentrates into a single point of vulnerability. Geographic diversification, which acts as an implicit insurance on most commodity markets, is structurally absent here.
A contrast with oil makes this tangible. When a major oil basin cuts output, dozens of other zones can, at varying costs, raise theirs within months, and strategic reserves provide a substantial buffer; the price rises, but the adjustment is shared between volumes and price, which bounds the amplitude. Cocoa has none of these levers. No region can substitute for West Africa within the season, no public strategic stock exists on the scale of oil’s, and the tree imposes its own calendar. For a comparable percentage deficit, oil absorbs a measured rise, cocoa a surge. The difference owes nothing to the speculative nature of one or the other, but to the physical structure of their supply — diversified and responsive on one side, concentrated and fixed on the other.
The second property is biological inertia. A cocoa tree planted today does not bear fruit for several seasons and reaches full yield much later still; conversely, an ageing orchard or one struck by swollen shoot virus is not replaced within a single season. Cocoa supply is therefore almost insensitive to price in the short run: the 2024 surge could trigger no rapid production response, whatever the financial incentive. It is this rigidity, which we analyse through the biological rigidity of supply, that explains why adjustment could not run through volumes. The price signal, however powerful, takes years to translate into additional productive trees — and when those trees finally come into production, the deficit that justified the high price has often already vanished, which programmes the next surplus.
From these two properties follows an implacable consequence, which a simple illustration makes clear. Suppose a market in 10% deficit. On a market with elastic supply, the price rises, production responds, and the gap closes partly through volumes: the price only has to rise moderately. On the cocoa market, where supply is fixed in the short run and concentrated, no additional volume can fill the gap within the year. Balance can only be restored through demand, and since chocolate demand is price-inelastic, it takes a very high price to discourage the 10% of excess consumption. The price must therefore do all the rationing on its own — hence the scale of the rise. Then, when supply rebuilds and demand has durably contracted, the same mechanism runs in reverse: the price must fall sharply to revive a consumption the rise had destroyed. The violence of the round-trip is not an accident; it is the mechanical signature of a market deprived of a quantity valve. Whether a market has a quantity valve at all is the kind of physical constraint on which the physical-constraints reading of commodity regimes rests.
This rigidity is not unique to cocoa. Coffee and sugar share neighbouring traits, and natural gas knows, for other reasons, the same inability of supply to respond fast. But cocoa presents a particularly acute form of it, because geographic concentration is layered onto biological inertia: few markets combine the two constraints to this degree. It is that combination, and not either one taken alone, that explains the singular amplitude of the 2024-2026 episode. In depth: the compared cycles of cocoa, coffee and sugar.
This mechanism programmes an oscillation. Economists have long modelled it under the name of the cobweb dynamic: when supply responds to price with a long lag, the market does not converge on equilibrium, it overshoots alternately in one direction then the other. Today’s high price triggers replantings whose output will arrive only years later, at a point when the deficit has vanished; that late supply then creates a surplus that depresses the price, discourages orchard maintenance, and sets up the next deficit. Cocoa does not settle on a resting price: it circles around one, in cycles whose length tracks the biological cycle of the tree.
Within this system, inventories are the only available shock absorber — and a thin one. Unable to adjust production in the short run, the market has only accumulated stocks to absorb a shock. Yet the stocks-to-grindings ratio falling to 27.4% in 2023/24 means only a narrow margin remained before physical rupture. When the buffer is this small and production cannot respond, price becomes the sole adjustment variable and must move all the more violently. The rebuilding of certified stocks observed in 2025 and 2026 conversely gave the market room to breathe and allowed the price to recede.
This reading sheds light on a fact the public debate largely overlooked. The central scenario held by many participants in early 2025 assumed a gradual, orderly normalisation of prices. Normalisation did occur, but it was anything but orderly: a market with rigid supply does not deflate down a gentle slope, it readjusts in lurches, because harvest expectations move by abrupt revisions rather than continuous adjustments. The disagreement is not about direction — most observers saw the fall coming — but about mechanism: mistaking supply rigidity for mere speculative volatility leads to underestimating the size of the moves this market can produce, up as well as down.
5. Two false readings to set aside
The 2024-2026 episode fed two opposing narratives, appealing in their simplicity, but both missing the essential point.
The first false reading is that of a pure speculative bubble. On this view, funds artificially inflated the bean’s price before the bubble burst. The numbers counsel caution. When the physical deficit reaches 439,000 tonnes and the stocks-to-grindings ratio falls to 27.4%, fundamentals are already strained before the mass arrival of capital. Speculation amplified the amplitude, lengthened the rise and accelerated the fall when funds withdrew; it did not create the shortage. Reducing the episode to a financial frenzy means ignoring the production deficit that forms its base — and being unable to understand why the same pattern could recur at the next poor West African harvest, independently of any market behaviour.
The second false reading files cocoa among the legs of a commodities supercycle. The analogy is tempting, because the cocoa surge coincided with renewed interest in real assets. It is nonetheless misleading. A supercycle is defined by structurally rising demand, driven by industrialisation or the energy transition, which durably supports a broad range of commodities. Cocoa does not fit that frame: its demand is stable, its surge was born of a localised, idiosyncratic supply shock, and its near-70% reversal in under two years directly contradicts the idea of a long-run uptrend. Cocoa is too small and too specific to signal anything about the global macroeconomic cycle.
This distinction carries a methodological weight. Some commodities can legitimately be read as macroeconomic signals: this is the case for oil, where one can treat reading a commodity price as a signal of the global industrial cycle, or for gold as a monetary signal of real-rate expectations and distrust of the dollar. Cocoa does not belong to that category. Its price says nothing about world growth or monetary conditions: it speaks to the health of the orchards of two West African countries. Conflating the two registers — a global macro signal and a regional supply shock — leads to over-reading the move and drawing mistaken conclusions about the state of the economy.
A recent development illustrates the nuance. In January 2026, cocoa was added to the Bloomberg Commodity Index, one of the major commodity benchmarks tracked by index funds. This inclusion marks a step in the financialisation of the bean: it widens the base of investors mechanically exposed to its price, independent of any fundamental view. It would be tempting to read it as confirmation of full asset-class status, or even of a supercycle. That would reverse cause and effect: cocoa enters the index because its surge made it visible and liquid, not because some new structural demand is carrying it. Financialisation is a consequence of the episode, not its cause, and it may in future add a further source of volatility, without changing anything about the physical supply rigidity that remains the market’s engine.
Placed against the broader history of soft commodities, the episode looks less singular than recurrent. Coffee, sugar and cotton have all delivered their own boom-busts, each rooted in a localised supply shock and amplified by inelastic demand and thin inventories. The common thread is not speculation but structure: agricultural markets whose supply is slow to respond and, often, geographically concentrated, are prone to violent cycles by construction. Cocoa is the most acute current example because it layers extreme concentration onto a long biological lag, but the pattern is familiar. Reading the 2024-2026 round-trip as a one-off financial aberration misses this lineage — and the predictable lesson that the next supply shock, in cocoa or in a neighbouring soft, will produce a similar shape.
It remains to name what could invalidate the structural reading defended here. If the replanting programmes run in West Africa, sometimes in partnership with the large processors, succeeded in durably diversifying producing zones or shortening the time to fruiting, supply rigidity would ease and the amplitude of cycles would fall. Likewise, a meaningful build-out of production in Latin America or Asia would reduce geographic concentration. These developments are slow and uncertain, but they exist: the fragility described in this study is not an eternal fate, it is a feature of the market as it is structured today.
To read an agricultural market, two questions matter more than the price level: is supply geographically concentrated, and can it respond quickly to a price signal? When both answers are “concentrated” and “no”, adjustment runs entirely through price, and the amplitude of cycles becomes structurally high, independently of speculation. This frame applies to cocoa, partly to coffee and sugar, and helps tell a regional supply shock apart from a genuine macroeconomic signal.
6. What a record teaches — and what it does not say
There remains the question every price peak imposes: what can be inferred from it about what comes next? The answer, counterintuitively, is: almost nothing about future direction. A record is a dated fact, the result of an alignment of supply shocks and market dynamics at a given moment. It documents a past strain; it does not project a path.
The 2024-2026 round-trip provides the demonstration. Those who, at the December 2024 peak, concluded that cocoa would never again be cheap were wrong; those who, six months earlier, saw $12,000 as a passing anomaly bound to dissolve within weeks were equally wrong. Both camps made the same error: extrapolating a future path from an extreme point. On a market with rigid supply, records are precisely the moments when extrapolation is most dangerous, because price there reflects an instantaneous scarcity rather than a trend — and that scarcity, by construction, will eventually resolve once supply rebuilds.
This epistemic stance is not a rhetorical detail: it structures the whole of this study, and we devote a specific analysis to what a record does not signal. Institutional forecasts themselves illustrate the necessary humility. In early 2026, the bank ING was guiding toward a London cocoa average around £3,400, roughly $4,586 for the year — well off the extremes, but still above pre-2023 norms. These estimates remain conditional: the return of a weather shock in West Africa would be enough to invalidate them. The risk, on this market, is never the one the latest price move puts on display.
One bound is nonetheless worth keeping in mind: the cost of production. Over the very long run, a price durably below the cost of cultivation would eventually discourage maintenance and replanting, and so dry up supply and support the price from below — a moving floor, a function of inputs, labour and administered farmgate prices. This floor is neither a precise level nor a target, and it points to no entry or exit moment; it merely reminds us that supply rigidity cuts both ways. Just as it prevents supply from responding quickly to a high price, it eventually removes unprofitable orchards from the market when the price collapses, which mechanically bounds the decline over a long horizon.
One variable this study watches without settling must be added: the public policies of producing countries. Côte d’Ivoire and Ghana administratively set the price paid to the farmer, govern replanting and negotiate a quality differential meant to better remunerate their growers. A regulatory tightening, a reform of the farmgate price or a change in stock management would reshape the reading of the market far more surely than any extrapolation of the chart. These decisions, taken in two capitals, weigh on the world price more than most financial commentary — and that is what makes this risk less visible than others, and therefore easier to ignore.
The human dimension of this market completes the picture, and it is more than anecdotal. The income of millions of West African growers hangs on these trade-offs. To try to lift that income, Côte d’Ivoire and Ghana jointly introduced, in the late 2010s, a living income differential — a premium added to the world price meant to better remunerate the producer. During the 2024 surge, the world price dwarfed that premium, which looked trivial against beans above $10,000; in the collapse, by contrast, the mechanism and the administered farmgate price become decisive in cushioning the fall in farm income. This interplay between market price and administered prices is one of the traits that set cocoa apart from a purely financialised commodity, and it conditions, over time, the very capacity of supply to rebuild.
For the different actors, the round-trip did not mean the same thing. The West African grower, whose income depends on the administered farmgate price rather than the world quote, captured only a delayed fraction of the rise, and the fall exposes a revenue risk that public mechanisms try to cushion. The processor saw margins squeezed on the way up, then weighed down by hedges on the way down. The consumer faced higher, durably sticky retail prices, regardless of the bean’s retreat. The trader and the financier, finally, navigated extreme volatility, a source of gains for some and losses for others. This diffraction of effects along the chain explains why a single price move is told in several ways depending on where one stands — and why the headline quote alone says so little about what the chain actually lives through.
Cocoa did not experience a bubble: it showed that concentrated, rigid supply leaves price alone to absorb everything, on the way up and on the way down.
Conclusion
The cocoa round-trip between late 2024 and mid-2026 lends itself to several readings, and no future path can be inferred from it with certainty. What the episode does establish is a structural property: a market whose supply depends for close to 70% on a single region, and whose orchards take years to respond to price, is condemned to wide-amplitude cycles, because price there plays the role of the sole adjustment variable. Speculation, climate shocks, disease, demand destruction are the successive triggers; the structural fragility is permanent.
This reading does not say where the price will go. It says where to look. As long as West African concentration and the biological inertia of supply remain, cocoa will stay a market capable of producing misleading records and brutal collapses, with neither announcing the other. The next poor harvest will replay the same mechanics; the next good harvest will replay them in reverse. Understanding that asymmetry is worth more than betting on its direction — and that is precisely what the following chapters of this study set out to decompose, mechanism by mechanism, from the physical value chain to the futures market.
Three variables deserve attention from anyone following this market, though none amounts to an instruction. The first is the state of West African harvests, readable in Ivorian port arrivals and the estimates of the International Cocoa Organization: this is where supply is decided. The second is the path of grindings, which reveals whether the demand destroyed by the rise returns or stays durably curtailed. The third is the gap between administered farmgate prices in Côte d’Ivoire and Ghana, whose divergence speaks to cross-border flows and to the reliability of official statistics. Following these three variables does not say where the price will go; it only allows one to understand, in real time, which of the two regimes — deficit or surplus — governs the market.
Frequently asked questions
Why did cocoa reach such a high level in 2024? The first cause is a physical deficit: according to the International Cocoa Organization, 2023/24 production fell short of grindings by some 439,000 tonnes, on a market where close to 70% of supply comes from West Africa and where no other region can quickly offset a poor harvest. Speculation and margin calls amplified the move, but did not create it.
Will chocolate prices fall now that cocoa has dropped? Not mechanically. Cocoa is a limited share of a bar’s cost, manufacturers hedge months in advance, and retail prices are sticky on the way down. Transmission between the bean’s price and the shelf price is slow and incomplete, in both directions. Also relevant: Cocoa, Food Inflation, Chocolate Price Transmission and the CPI.
Does the 2025-2026 collapse mean the cocoa crisis is over? The decline reflects a return toward surplus, driven by rebuilding supply and contracting demand, but the structural fragility of the market remains intact. As long as supply stays concentrated and slow to renew, a fresh yield shock can restart a wide-amplitude cycle.
Why did cocoa trade richer than copper? Because its price has to absorb, on its own, all the adjustment of a rigid-supply market. At the height of the deficit in late 2024, an extreme price was needed to ration demand, lifting the bean above an industrial metal that is far more strategic — a temporary reversal that captures the anomaly of the market.
- Cocoa fell from about $12,600 per tonne in late 2024 to $3,800-$4,000 by mid-2026, roughly 70% lower, with most of the decline occurring in 2025.
- The surge was born of a measured physical deficit (about 439,000 tonnes in 2023/24 per the ICCO), not a mere speculative bubble: speculation and margin calls amplified a real supply shock.
- The structural cause is a supply concentrated at close to 70% in West Africa and unable to respond fast, for lack of substitute basins and because of the cocoa tree’s biological inertia.
- When supply cannot adjust through volumes, price must adjust everything: hence very wide cycles, in both directions, independently of speculation.
- A record is a dated fact, not a forecast: neither the 2024 peak nor the 2026 trough says anything about the future direction of the price.
Last updated — 20 September 2026
Disclaimer – Financial Information: The analyses, commentary, and content published on eco3min.fr are provided for informational and educational purposes only. They do not constitute investment advice or a solicitation to buy or sell financial instruments. Past performance is not indicative of future results. All investment decisions involve risk and are the sole responsibility of the reader.
Read next
Full pillar →IMO 2020: the regulatory shock that rewrote product spreads
An environmental rule on marine sulfur can move a refining spread more than a swing in crude. IMO…
The 2022–2023 refining golden age: anatomy of an episode
In 2022, refined fuel prices climbed faster than crude. That gap, measured by the 3-2-1 crack spread, reached…
Diesel versus gasoline: why the two crack spreads diverge
The 3-2-1 crack blends gasoline and distillate into a single number, and that convenience hides something the market…


