
Gold Mine Supply: Why Price Does Not Make Production

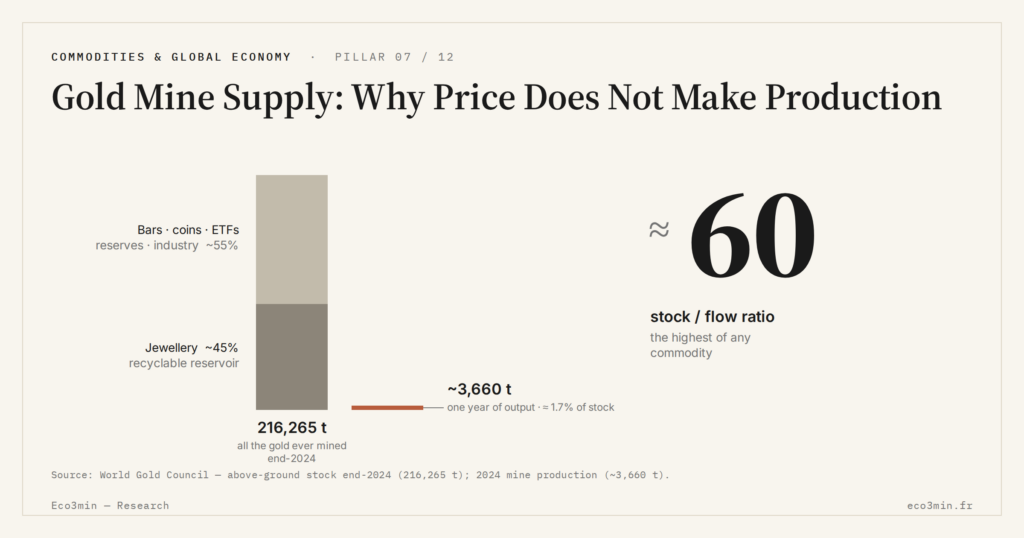
Gold supply barely responds to its price: mine production stays nearly flat even at peaks, and the stock already extracted dwarfs the annual flow. It is this inertia, captured by the stock-to-flow ratio, that sets gold apart from ordinary commodities.
TL;DR
Mine output cannot accelerate like a central bank's printing: gold's supply grows only a few percent a year, so decades of past production dominate each year's flow.
- World mine production hovered near 3,670 tonnes in 2025, up only about 1% despite record prices, and has plateaued since the late 2010s as ore grades fall and major discoveries grow scarce.
- With the above-ground stock near 216,000 tonnes (World Gold Council) against an annual flow around 3,500 tonnes, gold's stock-to-flow ratio sits near sixty, the highest of any commodity, so new supply adds only about 1.7% a year.
Understanding why output does not follow price illuminates a founding property of the metal: its monetary behaviour rests not on raw scarcity, but on the slowness of its renewal.
A supply that does not respond to price
Gold’s singularity begins with its supply. In 2025, world mine production hovered near 3,670 tonnes, up only about 1%, even as the price set record after record. On a classic commodity market, such prices would trigger a wave of investment and a jump in output; for gold, the effect is marginal.
The reasons are geological and operational. Between the discovery of a deposit and its entry into production, ten to twenty years often pass: exploration, studies, permits, construction. Ore grades decline, forcing ever more rock to be processed for the same amount of metal, and production costs rise. A price signal, however strong, takes a decade or more to translate into extra tonnes, when it does at all.
Indeed, world mine production has plateaued since the late 2010s, despite the rising trend in prices. Some major producing countries, including China, have seen extraction stagnate under environmental regulation and the depletion of the most accessible deposits. The idea of «peak gold» is debated, but the observation of an inelastic supply is solidly established. The same reasoning, applied to silver, is laid out in the price-inelastic nature of by-product silver supply.
Two factors deepen this rigidity. On one hand, major discoveries are growing scarce: despite sustained exploration budgets, the number of large deposits brought to light has declined for years, a sign that the most accessible deposits have already been worked. On the other, all-in sustaining costs rise with mine depth, energy prices and environmental requirements, so that producers’ margins do not widen as much as the price would suggest.
Mining companies’ behaviour reinforces the picture. Chastened by past phases of overinvestment followed by price drops, many now favour return on capital and caution over volume expansion. Even facing high prices, they hesitate to commit projects whose profitability would depend on those levels holding for ten or fifteen years. This financial discipline adds a deliberate inertia to the geological one.
The stock-to-flow ratio, gold’s monetary signature
The consequence shows in a telling indicator: the stock-to-flow ratio, which relates the quantity of gold already extracted to annual production. At the end of 2024, the above-ground gold stock approached 216,000 tonnes, according to the World Gold Council, and kept rising toward 220,000 tonnes in 2025. Set against an annual flow of about 3,500 tonnes, this stock gives a ratio on the order of sixty.
This figure is the highest of any commodity. For oil or copper, available stock is counted in months or a few years of consumption; for gold, it would take some sixty years of production at the current pace to rebuild the existing stock. Put differently, annual new supply represents only about 1.7% of the stock: it cannot meaningfully dilute it.
It is precisely this property that grounds gold as a scarce, durable metal as a monetary asset. A commodity money holds lasting value only if no one can sharply increase its quantity; gold meets that test by construction, where a commodity whose output adjusts quickly to demand cannot.
The metal’s near-indestructibility reinforces the effect. Almost all the gold ever extracted still exists, as jewellery, bars, coins or reserves. The stock does not wear out or vanish: it accumulates, which explains why the flow weighs so little against it and why the ratio stays durably high.
The stock-to-flow notion has had a second life beyond gold. It has been applied to other supply-constrained assets, starting with bitcoin, whose programmed scarcity is often compared to the metal’s. But gold keeps a distinctive trait: its high ratio results not from a written, amendable rule, but from a physical and historical constraint accumulated over millennia of extraction. A companion study: physical gold ETFs versus miners.
Another way to read this ratio is to translate it into a supply growth rate. A stock growing by about 1.7% a year corresponds to a slow and remarkably stable expansion, far removed from the monetary creation central banks can decide. It is this constancy, as much as the level of the ratio, that anchors confidence in the metal’s value over the long run.
Recycling, a price-sensitive valve
One part of supply, however, does respond to price: recycling. In 2025, recycled gold accounted for about 1,400 tonnes, nearly a quarter of total supply. Unlike mine production, this source reacts quickly to prices: when the price climbs, households and industry resell more jewellery or recover the metal from electronic components.
This elasticity of recycling acts as a valve, but a limited one. It does not change the inert nature of the stock: it merely returns already-extracted gold to circulation temporarily, without creating new metal. The distinction is essential for anyone seeking to understand how the gold price forms: it is at the meeting of a rigid mine supply, a responsive recycling stream and a variable demand that the price is set, day after day, on the benchmark market.
The respective share of these sources also illuminates the resilience of prices. When jewellery demand softens, recycling falls too, which withdraws supply just when the market needs it least. The system thus has a form of self-regulation, but one that operates at the margin, never calling into question the rigidity of the mine leg.
The geography of production adds a nuance without overturning the overall picture. A few countries, including China, Russia and Australia, concentrate a large share of world extraction, which exposes supply to local political or regulatory hazards. But these variations play at the margin of total flow: they can shift the origin of the metal without meaningfully raising the global quantity produced each year.
The size of the recyclable reservoir is worth placing. Of the roughly 216,000 tonnes above ground, jewellery accounts for nearly half, the rest split between bars, coins and exchange-traded funds, official reserves and industrial uses. It is mainly this vast pool of jewellery, accumulated over centuries, that can return to the market when the price climbs, and which forms the true reservoir of supply elasticity, in the absence of mine production.
Why this makes gold a money
Together this draws the deep difference between gold and industrial commodities. For copper or oil, a high price eventually calls forth new supply that weighs prices down: the market self-corrects through quantities. For gold, that channel is so slow that, on the scale of investment cycles, it is almost inoperative. The price is therefore not pulled back toward a production cost by a wave of supply.
This inelasticity explains why gold behaves more like a store of value than a consumable commodity. Its value depends on the demand to hold it, not on a supply-demand balance of physical flow. This logic illuminates Asian gold demand and, more broadly, the determinants of gold’s price, where holding dynamics prevail over those of production.
Placed within structural commodity and resource markets, gold supply appears as a limiting case: a resource whose scarcity lies less in the ground than in the slowness of its extraction. It is that slowness, not an imminent exhaustion, that gives the metal its stability of value over the long run.
The most telling contrast is with fiat money. A central bank can raise the quantity of money in circulation quickly and in large proportion; gold supply, by contrast, can grow only by a few percent a year, whatever happens. It is this asymmetry that makes gold a recurring point of comparison in periods of doubt about the value of currencies, as its role against public debt recalls.
- Gold mine production, about 3,670 tonnes in 2025, barely grows despite record prices: its supply is highly inelastic.
- The stock-to-flow ratio, on the order of sixty, is the highest of any commodity: new supply does not dilute the existing stock.
- Only recycling, about a quarter of supply, reacts quickly to price; it returns already-extracted gold to circulation, without creating any.
Scarcity lies in time, not only in the ground
Gold supply illustrates a particular scarcity: not that of a stock about to run out, but that of a flow that cannot accelerate. Reserves remain to be extracted, on the order of several decades of production, but they change nothing about the fact that the pace at which the metal reaches the market stays slow and predictable.
This feature will stay open to technical advances and discoveries, without overturning the essentials. As long as production can grow only in slow steps, the stock will keep dominating the flow, and gold will retain the signature that sets it apart from other commodities. The metal’s scarcity owes less to its quantity than to the patience its extraction demands. It is that imposed patience that, in the last analysis, sustains its function as a store of value. Adjacent reading: our decoding of structural signals in raw materials.
Last updated — 12 July 2026
Disclaimer – Financial Information: The analyses, commentary, and content published on eco3min.fr are provided for informational and educational purposes only. They do not constitute investment advice or a solicitation to buy or sell financial instruments. Past performance is not indicative of future results. All investment decisions involve risk and are the sole responsibility of the reader.
Read next
Full pillar →Reading the refinery utilisation rate: the threshold, the season, the turnarounds
A refinery runs full near ninety percent, not a hundred: the last slice of nameplate capacity is a…
IMO 2020: the regulatory shock that rewrote product spreads
An environmental rule on marine sulfur can move a refining spread more than a swing in crude. IMO…
The 2022–2023 refining golden age: anatomy of an episode
In 2022, refined fuel prices climbed faster than crude. That gap, measured by the 3-2-1 crack spread, reached…


