
Where Does Silver Come From? A By-Product Supply That Barely Responds to Price

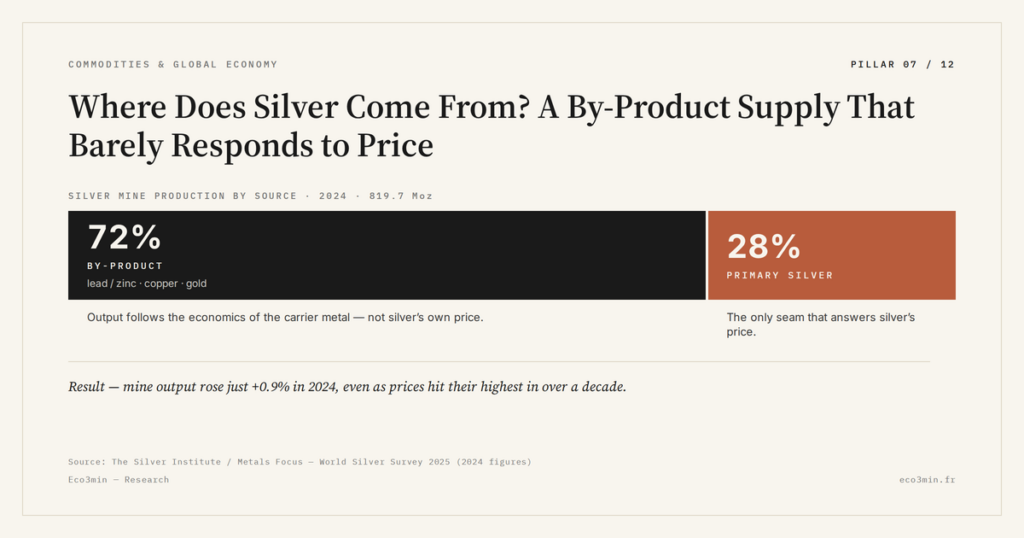
Silver is rarely mined for its own sake: close to three-quarters of the metal comes out of the ground as a by-product of lead, zinc, copper and gold. That dependence makes supply strikingly deaf to silver’s own price.
TL;DR
Silver has run a physical deficit for five straight years, yet no shortage has appeared: decades of above-ground bars and coins are quietly drawn down to bridge the gap.
- About three-quarters of mined silver is a by-product of lead, zinc, copper and gold; primary mines supply only around 28%, so output tracks the economics of the carrier metal, not silver's price.
- Mexico produces close to a quarter of the world's silver (about 6,300 tonnes in 2024), and a new primary mine takes five to seven years to open, keeping supply slow to answer demand.
Understanding where silver comes from is to understand why a deficit can persist for years without production ever really adjusting. The same mechanics are viewed differently in The 2021 Silver Squeeze: Financialization, COMEX and Its Limits.
1. A metal mined for another: the by-product mechanic
Unlike gold, most of which comes from dedicated mines, silver is first of all a companion of extraction. According to Silver Institute data, the world’s leading source of silver metal in 2024 was lead and zinc ore, which supplied close to 30%. Primary mines — where silver is the main target and makes up most of the revenue — accounted for only about 28% of production. The rest emerged as a by-product of copper and gold extraction, the latter source posting the strongest growth in 2024, up 12% to 13.9 million ounces. In all, on the order of three-quarters of the world’s mined silver is therefore a co-product, its fate tied to the economics of another metal.
This structure has a direct and counter-intuitive consequence. The decision to open, expand or close a zinc or copper mine obeys the economics of zinc or copper, not of silver. A polymetallic mine does not double its pace because silver has doubled, nor cut it because silver has fallen: it follows the price of its main metal. The silver that results is, in a sense, a geological dividend imposed on the market, its volume determined elsewhere. This mechanic binds silver’s fortunes to those of other industrial metals, and makes copper as silver’s carrier metal a key actor in its supply as much as in its demand.
The primary share, a minority but strategic, is the only seam genuinely sensitive to silver’s price. A handful of specialised operations form its core: in Mexico, the Juanicipio mine produced around 18.6 million ounces in 2024, and Saucito about 15.5 million, two of the largest primary silver mines in the world. But these volumes, even combined, are not enough to make global supply responsive: they stay diluted in a production dominated by by-product. So when demand surges, the market can lean only on this primary fringe and on recycling to respond quickly, the bulk of output remaining anchored to the cycles of lead, zinc and copper. This dependence also throws the structure of silver demand into relief by contrast: a demand driven by industry faces a supply it does not command.
The co-product logic also blurs forecasting. The amount of silver from a copper or gold mine depends on the grade of the deposit being worked, which varies from site to site and year to year. The sharp rise in silver from gold mines in 2024 thus reflects not a wish to extract more silver, but the mineralogical profile of the ores processed. For the analyst, this means part of supply fluctuates for reasons unrelated to the silver market itself — a geological noise that makes annual balances less readable than they appear.
2. The price-inelasticity of supply and its consequences
From this structure flows the most important property of the silver market: the price-inelasticity of supply. In plain terms, the quantity produced responds poorly, and above all slowly, to price moves. When industrial demand accelerates, metal cannot flow in quickly, since most production is governed by other markets. The supply curve is steep: it takes marked price rises to release marginal quantities, for instance by restarting a dormant primary mine or stepping up recycling. This structural slowness is the deep cause of the breadth of silver’s price swings, and of what is reflected in the gold/silver ratio as a signal.
The market bears the visible mark of it. Again according to the Silver Institute, mine production rose only 0.9% in 2024, to 819.7 million ounces — about 25,000 tonnes — despite prices at their highest in more than a decade. Recycling, at 193.9 million ounces, played a partial adjusting role, but it too depends on price and on the availability of old silver-bearing objects. The result: the market recorded a physical deficit of 148.9 million ounces in 2024, the fifth consecutive year of imbalance. So durable a deficit would be unthinkable in a market with responsive supply, where production would adjust to close the gap; here, the adjustment runs through price and through destocking, not through a quick influx of new metal.
This raises a natural question: if the market runs a deficit, where does the missing metal come from? The answer lies in above-ground stocks — bars, coins and inventories accumulated over decades — which are drawn down to bridge the gap. Such stocks are large, so a multi-year deficit does not mean shortage in any immediate sense; it means the buffer is shrinking. But the buffer is finite, and as visible inventories thin, the market grows more sensitive to any disruption in flow. It also explains why silver can stay calm for long stretches and then move violently: as long as stocks cushion the deficit, prices drift; once that cushion is questioned, the inelastic supply has no quick answer.
A timing constraint compounds this. Opening a new primary silver mine typically takes five to seven years between the investment decision and first production, the time for permits, financing and construction. This inertia creates a permanent lag between the price signal and the supply response: by the time new metal finally arrives, the market context has often changed. Demand, for its part, can turn within months — especially its investment component, the most volatile. This mismatch between slow supply and fast demand is the source of the market’s chronic nervousness, which also weighs on the pressure of solar demand when it accelerates faster than mines can follow.
3. The geography of production and its fragilities
Silver production is also geographically concentrated, which adds a layer of risk. Mexico remained the world’s top producer in 2024, with about 6,300 tonnes — close to a quarter of global output — a position held for decades, supported by high-grade deposits and dense mining infrastructure. Then come China, Peru, Bolivia and Chile. Tellingly, the production hierarchy does not match that of reserves: Peru holds the largest known reserves, ahead of Australia and Russia, while Mexico produces well beyond what its reserve share would suggest. This concentration exposes the market to local hazards — regulatory, social, energy-related — in a small number of countries.
The year 2024 illustrated this sensitivity. The recovery of Mexican supply, driven by the return to full production of the Peñasquito mine after a stoppage, and higher lead and zinc extraction in Australia, supported world output; conversely, a decline in Chile partly erased it. A few mines and a few firms thus carry great weight: Mexico’s Fresnillo remains the world’s largest producer by volume, alongside players such as Poland’s KGHM or India’s Hindustan Zinc, for whom silver is only a by-product of their copper or zinc activities. For anyone interested in exposure to this metal, silver mining companies offer a very different profile from holding the metal directly.
The gap between reserves and production deserves a pause. That Peru holds the largest reserves without being the largest producer, and that Mexico produces well beyond its reserve share, is a reminder that the capacity to extract depends as much on investment, permits and workable grade as on the underlying geological stock. An abundant reserve does not convert mechanically into available supply. This nuance weighs on long-run projections: countries rich in reserves are not necessarily those that will close a future deficit, especially if mining effort lags demand.
At bottom, silver’s supply paints the portrait of a metal caught in a double dependence: geological, because it mostly leaves the ground at the whim of other metals; and temporal, because it takes years to answer a price signal. This rigidity is not a technical detail: it is what turns a passing imbalance into a durable tension, and what distinguishes silver’s dynamics from gold’s. Comparing this mechanic with gold’s supply inelasticity shows that the two metals, for different reasons, share a supply that is far from docile — a trait that sits within the broader balances of the markets for physical resources.
- About three-quarters of mined silver is a by-product of lead, zinc, copper and gold; primary mines account for only around 28%.
- Production therefore responds to the economics of the carrier metal, not of silver, which makes supply slow and unresponsive — hence the breadth of price swings.
- In 2024, mine production reached 819.7 Moz (+0.9%) despite high prices, and the market posted a fifth consecutive deficit, of 148.9 Moz (Silver Institute).
- Production is concentrated (Mexico, China, Peru, Bolivia, Chile), and opening a primary mine takes five to seven years, widening the gap between supply and demand.
Last updated — 7 July 2026
Disclaimer – Financial Information: The analyses, commentary, and content published on eco3min.fr are provided for informational and educational purposes only. They do not constitute investment advice or a solicitation to buy or sell financial instruments. Past performance is not indicative of future results. All investment decisions involve risk and are the sole responsibility of the reader.
Read next
Full pillar →Reading the refinery utilisation rate: the threshold, the season, the turnarounds
A refinery runs full near ninety percent, not a hundred: the last slice of nameplate capacity is a…
IMO 2020: the regulatory shock that rewrote product spreads
An environmental rule on marine sulfur can move a refining spread more than a swing in crude. IMO…
The 2022–2023 refining golden age: anatomy of an episode
In 2022, refined fuel prices climbed faster than crude. That gap, measured by the 3-2-1 crack spread, reached…


