
U.S. Consumer Prices vs the Fed’s 2% Target, Since 2020
Through 2024 and 2025, U.S. inflation cooled and the headline rate moved back toward the Federal Reserve’s 2% goal. That shift describes the rate at which prices change. It does not describe the level prices reached. This page separates the two, using the PCE price index, the measure the Fed targets, to track the cumulative level of U.S. consumer prices against the path a steady 2% inflation rate would have produced since January 2020. The full dataset is available below.
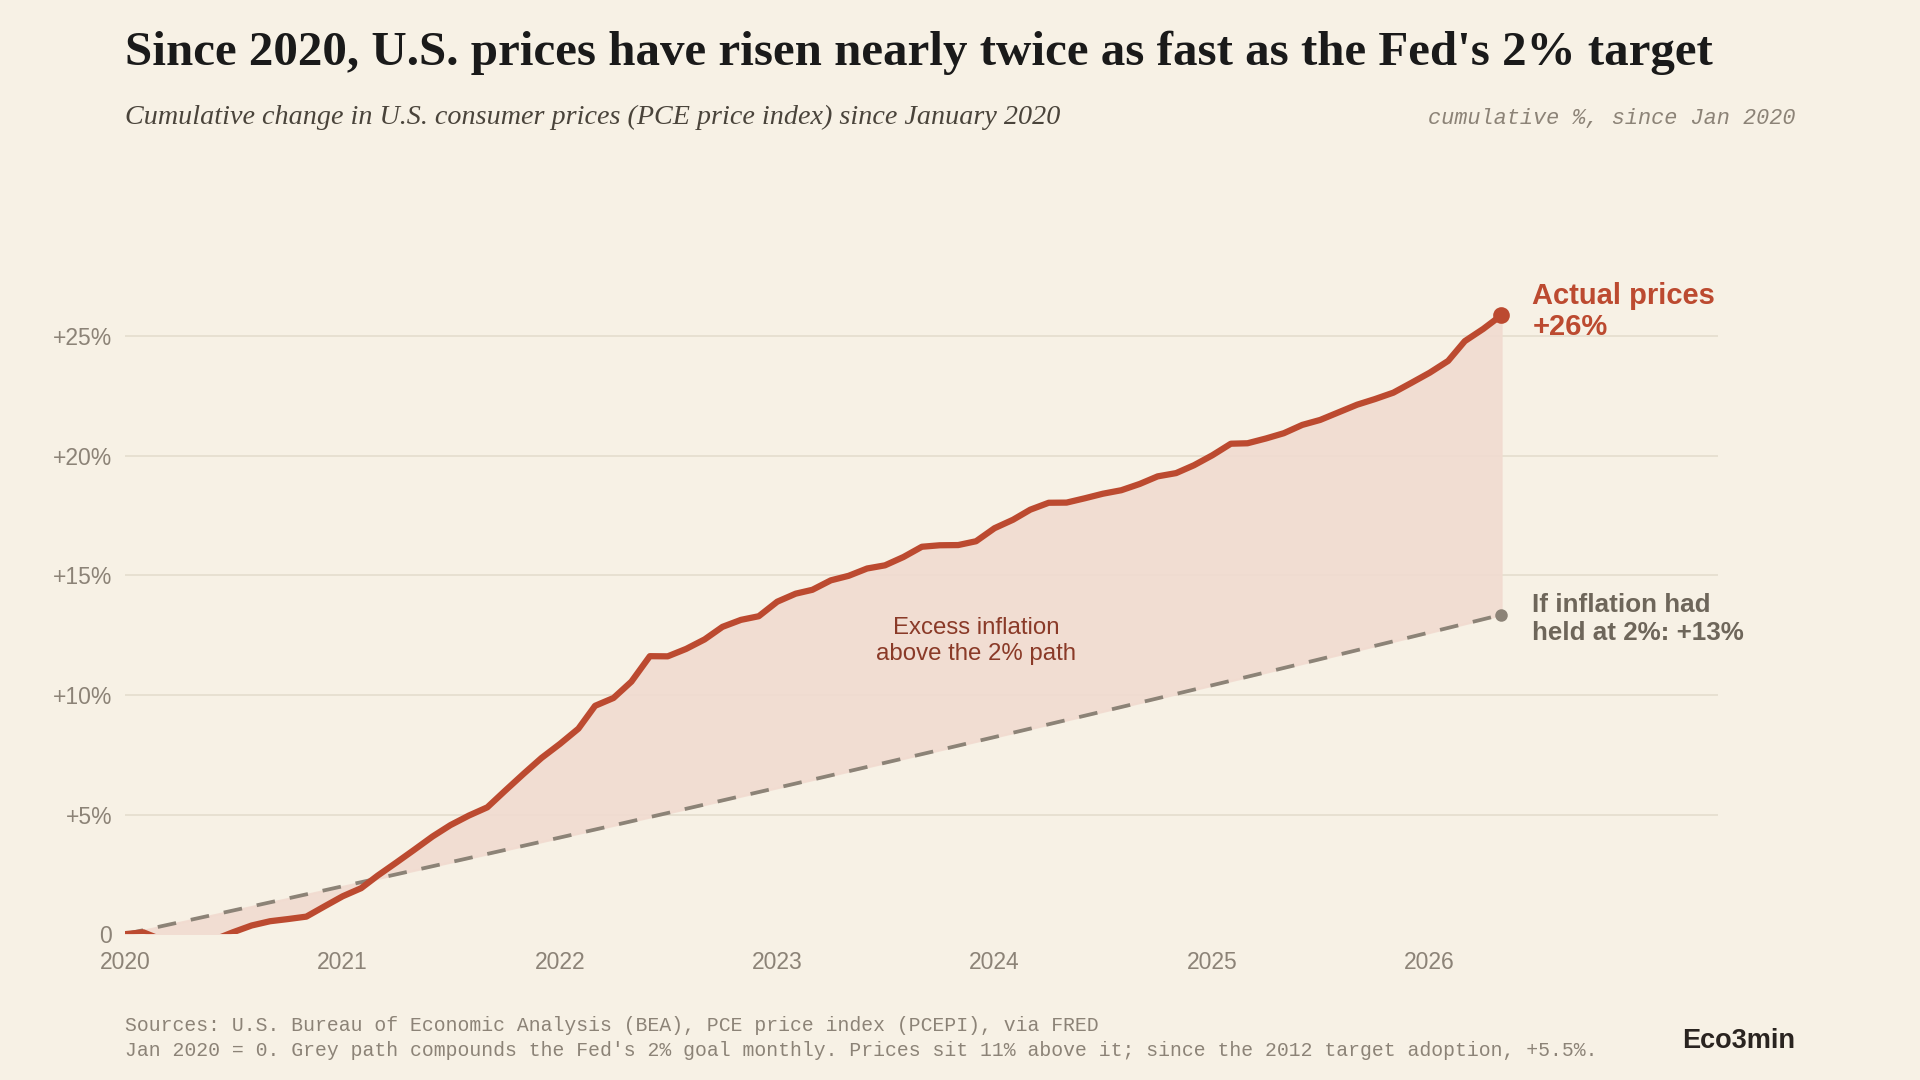
Since 2020, U.S. consumer prices have risen about 26%, nearly twice the 13% a steady 2% target would have produced, and that gap does not reverse on its own.
- By May 2026 the PCE price index sits about 11% above the level a continuous 2% path would imply (January 2020 base). Source: BEA PCE price index, via FRED.
- Not a base artifact: measured from the Fed’s 2012 target adoption the level is still 5.5% above the 2% path; from 2015, 8.7%; from 2018, 10.2%.
- Rate versus level: headline PCE inflation has stayed above 2% for 63 consecutive months (since March 2021), so the price level keeps moving further from the path, not back toward it.
The rate came down. The level did not.
The dominant read of 2024 and 2025 is that the U.S. inflation episode is largely behind us. Headline PCE inflation fell from a 2022 peak of 7.2% to a low of 2.3% in September 2024; core PCE eased from 5.6% to 2.6%. Commentary described a soft landing: inflation returning toward target without a recession. As a description of the rate of change, that read has support. The pace of price increases is far below its peak.
What the rate hides is the level. Inflation falling toward 2% means prices rise more slowly, not that they fall. Each month that PCE inflation prints above 2%, the price level moves further above the path a 2% target would have traced, and stays there. By May 2026 the PCE price index stood 25.9% above its January 2020 level. A continuous 2% rate over the same 6.3 years would have produced 13.4%. The level is therefore about 11% above the 2% path, and the gap has widened in every year since 2021. Headline PCE inflation has not printed below 2% in any single month since March 2021, a run of 63 consecutive months. Further reading: our analysis “US Inflation (1913–2026)”.
This is the distance the chart above measures: not how fast prices are rising now, but how far the accumulated level has moved from the reference a 2% target implies. The shaded area is that accumulated excess.
What the gap does and does not mean
Three qualifications matter, and the data supports stating them plainly.
First, a price level that does not return to an old path is the normal outcome of how the mandate is written. The 2% goal is a target for the rate of inflation, not for the level of prices. Returning the level to its pre-2021 path would require a sustained period of falling prices, and broad deflation has historically been associated with weaker output and employment, not stronger. The gap measures distance from a counterfactual, not a shortfall against the Fed’s actual objective, which is the rate. A closer look: our study “Inflation Explained”.
Second, this dataset measures prices, not purchasing power. Real purchasing power depends on the ratio of prices to incomes. Nominal wages and average hourly earnings have also risen over the period. Whether households are better or worse off depends on whether pay kept pace with the 26%, which varies across the wage distribution and is not what this chart measures. The price-level gap is one input into that question, not the answer to it.
Third, the headline figure includes volatile energy and food. The same calculation on core PCE, which strips both, gives a smaller but directionally identical result: the level about 24.5% above its 2020 value, roughly 9.8% above the 2% path. The gap is not produced by an energy spike alone. The “Core vs headline” toggle on the interactive chart shows the two lines side by side.
The gap holds from any starting point
A single base year, especially one chosen just before a price surge, invites the objection that the result is an artifact of where the clock starts. It is not. The table below recomputes the same comparison from several reference points. The level sits above the 2% path in every case, including from January 2012, the month the Fed formally adopted its explicit 2% target.
| Base (January) | Actual cumulative | 2% path cumulative | Level vs 2% path |
|---|---|---|---|
| 2012 (target adoption) | +40.1% | +32.8% | +5.5% |
| 2015 | +36.1% | +25.2% | +8.7% |
| 2018 | +30.0% | +17.9% | +10.2% |
| 2020 (pre-pandemic) | +25.9% | +13.4% | +11.0% |
Source: BEA PCE price index (PCEPI), via FRED. Data through May 2026. The 2% path compounds the Fed’s longer-run goal monthly from the base. Eco3min calculation. Note that measured from 2012, the price level was running about 5.7% below the 2% path at the end of 2020 (inflation averaged under 2% from 2012 to 2020); the entire excess shown here was accumulated after 2021.
Key levels to watch
This is a descriptive monitoring frame, not advice.
Where the gap would stop widening. If monthly PCE inflation settles at or below roughly 0.17% (the monthly equivalent of a 2% annual rate) on a sustained basis, the level stops moving further from the path. It would only narrow during any stretch in which the index falls outright, a condition the U.S. has not seen at the index level since the 2020 shock. An outright fall in the index has its own name, and that is what the line between disinflation and deflation turns on.
Where the current reading is confirmed. As long as monthly prints stay above that pace, which they have every month since March 2021, the level continues to move further from the 2% path rather than back toward it. Were those monthly prints to turn back up, the sequence would join every US inflation second wave since 1948.
Calendar catalyst. The next monthly PCE release from the Bureau of Economic Analysis, and the following FOMC meeting, are the scheduled points at which these values update.
Methodology and sources
Metric. Cumulative change in the Personal Consumption Expenditures (PCE) price index, the inflation measure the Federal Reserve uses for its 2% goal. Headline (all items) is used for the main series; core (excluding food and energy) is shown for the measure-robustness comparison.
The 2% path. From the base month, the path compounds a 2% annual rate monthly: a base value scaled by 1.02 raised to (months elapsed divided by 12). It is the level the index would have reached had inflation run at exactly 2% from the base, expressed here as a cumulative percentage from that base.
The gap. “Level versus 2% path” is the ratio of the actual index to the 2% path value, minus one. At the May 2026 reading this is 25.9 over 13.4 in cumulative terms, or 11.0% in level terms from the January 2020 base.
What is not claimed. The page makes no causal attribution for the post-2020 inflation. It does not measure real wages, purchasing power, or distributional effects across the income scale. It compares the price level to a fixed-rate counterfactual; it does not evaluate monetary policy against the Fed’s actual rate objective.
Reproducibility. The dataset below contains the monthly PCE index and the cumulative actual and 2% path series from January 2012 to May 2026. Source series: BEA PCE price index (PCEPI), retrieved via FRED. The chart is built in Python.
Frequently asked questions
Why doesn’t the price level come back down once inflation falls?
Because falling inflation means prices rise more slowly, not that they fall. The index declines only during outright deflation, a sustained drop in the general price level. The Fed targets a 2% rate of inflation, not a return of the price level to a prior path, so a level that stays elevated after an inflation episode is the expected outcome rather than a deviation from the stated goal.
Why measure from 2020?
January 2020 is the last pre-pandemic month, a natural break point. It is also not the source of the result: the table above shows the level sits above the 2% path from 2012, 2015, and 2018 bases as well. The 2020 figure (11%) is the most visually direct because the two lines start together; the 2012 figure (5.5%) is the most conservative.
Headline or core?
Both are shown. Headline PCE includes food and energy and is the figure most directly felt at the register; core excludes both and is the Fed’s preferred gauge of the underlying trend. The level gap is about 11% on headline and about 9.8% on core from the 2020 base, so the conclusion does not depend on the choice. The choice of index does bite elsewhere, and comparing the four official inflation measures is what sets those terms.
Does an 11% gap mean households are 11% poorer?
No. This series measures prices, not purchasing power. Whether a given household is better or worse off depends on whether its income rose faster or slower than the 26% increase in prices, which differs across the wage distribution. The price-level gap is one side of that comparison; the income side is a separate measurement this page does not make. The other side of that comparison is where the gap between nominal and real wages sits.
Is an 11% gap large by historical standards?
In the decade before 2020, U.S. inflation averaged below 2%, so the price level ran below a 2% path rather than above it. The post-2021 period is the first sustained stretch in over a decade in which the level pulled materially above the 2% reference and stayed there. Longer history contains larger episodes, including the 1970s, when cumulative gaps were far wider. Closed only at the cost of a recession, the 1970s gap leads into the forced disinflation of the Volcker shock.
Download the dataset
Monthly PCE price index and the cumulative actual and 2% path series, January 2012 to May 2026, with sources.
Source: eco3min.fr, BEA PCE price index via FRED. Free to use with attribution (CC BY 4.0).
Conclusion
U.S. inflation, measured as a rate, has fallen well below its 2022 peak. Measured as a level, prices are about 26% higher than in January 2020, against the roughly 13% a continuous 2% rate would have produced, leaving the PCE price index about 11% above that path. The gap holds from every reference point tested, including the Fed’s 2012 target adoption, and on core as well as headline. That a central bank commits to a rate rather than to a level reflects a documented choice: the Fed’s shift to flexible average inflation targeting.
The distinction is descriptive, not a verdict: a price level that stays elevated after an inflation episode is consistent with a central bank that targets the rate of inflation rather than the level of prices. What the data establishes is narrower and often lost in the rate-focused commentary. A slower pace of price increases does not undo the increases that already happened, and on current monthly readings the level continues to move away from the 2% reference rather than back toward it. One household item makes that point in miniature, since US residential electricity prices adjusted for inflation, state by state outran the general index in 43 of 51 jurisdictions in the year to May 2026.
Last updated — 6 October 2026
Disclaimer – Financial and Legal Information: The analyses, commentary, and content published on eco3min.fr are provided for informational and educational purposes only. They do not constitute investment advice or a solicitation to buy or sell financial instruments. Past performance is not indicative of future results. All investment decisions involve risk and are the sole responsibility of the reader. Data, charts and calculated series are provided as is and may contain errors or lag behind their source: check any figure against the primary source cited before relying on it. Content describing laws, regulations or contracts reflects the law as of its publication date and does not constitute legal or tax advice; applying it to a specific situation requires a qualified legal or tax professional.