
Age at First Marriage in the U.S., 1890 to 2025 (Census)
The 1950s were the anomaly — not today
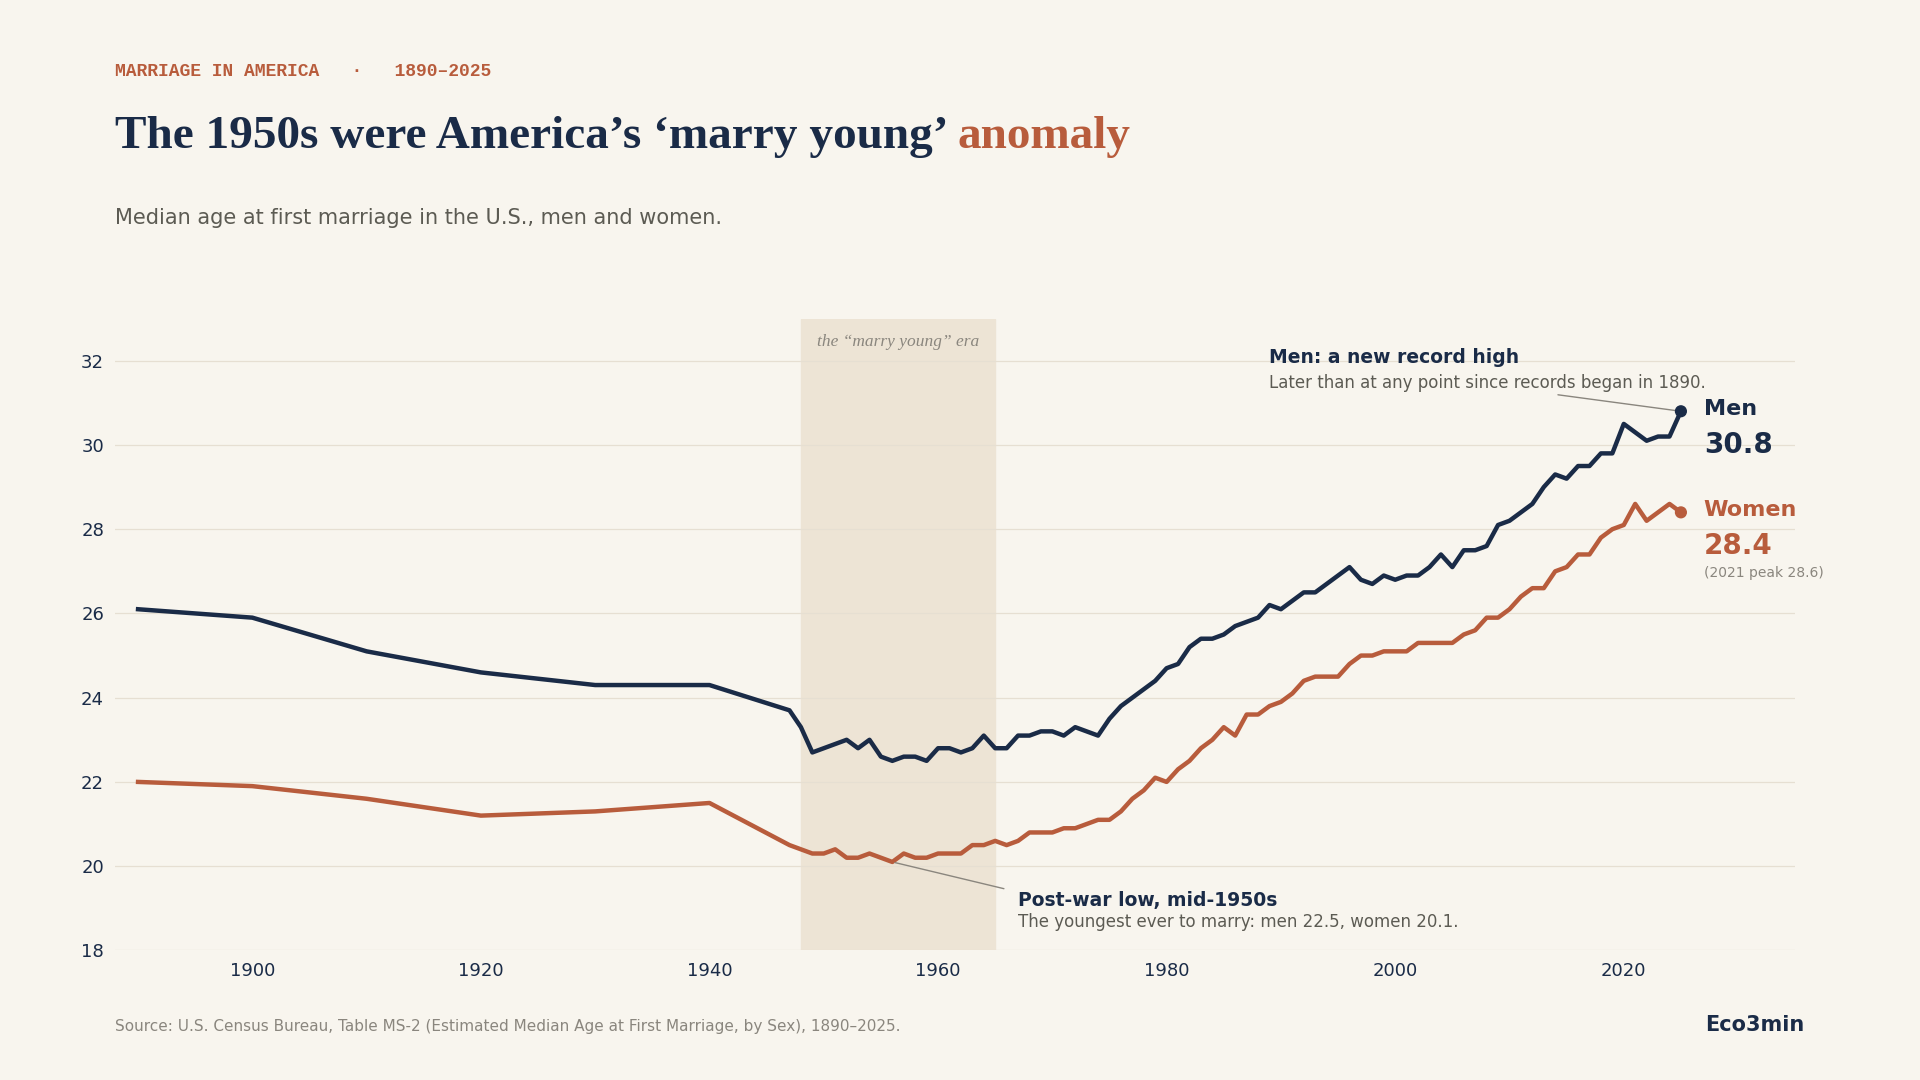
Median age at first marriage in the U.S. Hover the chart for any year. Toggle to focus on men or women.
The average marriage age in the US, which the Census Bureau measures as the median age at first marriage, reached a record 30.8 years for men in 2025 and 28.4 for women. The lowest ages in the series date from the mid-1950s.
The common framing of this trend treats today’s late marriages as a drift away from a long-standing norm of marrying young. The record since 1890 does not support that framing. Age at first marriage was already close to its modern range in the 1890s, fell to an all-time low in the years after the Second World War, and has been climbing back ever since. The “marry young” America of the 1950s was the exception in the series, not the baseline.
Key Findings at a Glance
Series: Median age at first marriage, United States, 1890–2025 (decennial 1890–1940, annual from 1947)
2025 — men: 30.8 years (record high)
2025 — women: 28.4 years (just below the 28.6 reached in 2021–2024)
Mid-1950s low — men: 22.5 years (1956, lowest on record)
Mid-1950s low — women: 20.1 years (1956, lowest on record)
1890 level — men / women: 26.1 / 22.0 years — already above the 1950s low
Men–women gap: 4.1 years in 1890, 2.4 years in 2025 — narrowed by roughly four-tenths
Related (not shown in the chart): mean age of mother at first birth rose from 21.4 (1970) to 27.5 (2023) — CDC/NCHS
The shape most people get wrong
Ask when Americans married young, and most answers point to a vanished tradition: a past in which people paired off in their late teens or very early twenties, before the modern economy pushed marriage later. The Census Bureau’s own series, which runs from 1890 to the present, tells a more specific story. The median age at first marriage did not climb steadily out of a youthful past. It traced a long U.
In 1890, the first year on record, the median man married at 26.1 and the median woman at 22.0. Those figures drifted down over the following half-century, then dropped sharply in the years after 1945. The low point arrived in the mid-1950s: 22.5 for men and 20.1 for women in 1956, the youngest ages recorded in the entire series. From there the line turned and has risen, with few interruptions, for seven decades — to 30.8 for men and 28.4 for women in 2025.
The implication is narrow but worth stating plainly. The early-marriage America that anchors much of the cultural memory of “how things used to be” corresponds to a roughly twenty-year window around the 1950s. It is the most distinctive feature of the series, but it is distinctive as a trough, not as a baseline. Today’s ages are not a departure from a deep historical norm of young marriage; they are among the highest readings in a record that never contained such a norm.
Even the 1890s married later than the 1950s
The single fact that does most of the work here is the comparison between the two ends of the series and its middle. A man marrying at 26.1 in 1890 was, by the median, older than a man marrying at 22.5 in 1956. The same holds for women: 22.0 in 1890 against 20.1 in 1956. The generation often invoked as the traditional standard married younger than their own great-grandparents had.
Several long-run shifts accompanied the climb out of the 1950s trough, though the age series by itself does not establish which caused which. The men–women gap, 4.1 years in 1890, narrowed to 2.4 years by 2025 as women’s ages rose faster than men’s over the period since 1890. And the broader sequencing of early adulthood moved with marriage: the mean age of mothers at first birth rose from 21.4 years in 1970 to 27.5 in 2023, according to CDC vital-statistics data. Marriage is one milestone among several that now arrive later than they did for the cohorts of the mid-twentieth century.
The same numbers, two readings
A single age series invites more than one interpretation, and the rise in marriage age is read in at least two well-developed ways. The chart itself does not adjudicate between them; it records ages, not reasons.
One reading emphasizes constraint. In this account, marriage is delayed because the conditions that once made early family formation feasible have eroded: the cost of housing relative to income, student debt, less stable early-career earnings, and the rising direct cost of raising children. On this view, later marriage is substantially a response to economic friction — people postpone a commitment they would otherwise make earlier. More on this: where this fits in the macro-regime map.
A second reading emphasizes choice and expanded options. Here, later marriage reflects the long rise in women’s educational attainment and labor-force participation, the spread of cohabitation as a stage that precedes or replaces early marriage, and a broader reordering of the life course in which education and career routinely precede marriage rather than follow it. On this view, later marriage is substantially a matter of changed preferences and opportunities, not of blocked ones.
These readings are not mutually exclusive, and serious work draws on both. What the age data establish is the shape of the trend and its scale; what they cannot establish, on their own, is the weight to assign each mechanism. That is precisely why the same chart is cited in support of opposing arguments about the modern family.
What the data does and does not say
Medians, not full distributions. The series reports the median age at first marriage, the age at which half of first marriages have occurred. It says nothing directly about the share of people who never marry, which has also changed over the period and which a median cannot capture. A rising median is consistent with both later marriage and less marriage; distinguishing the two requires different measures.
First marriages only. The figures cover first marriages, by design. They are not affected by remarriage patterns, but they also describe only the population that does marry at least once.
A definitional change in 2019. Beginning in 2019, the Census Bureau’s estimates include same-sex married couples. This is a small, documented change in coverage rather than a break that drives the long-run trend, which was already well established before 2019.
Decennial early, annual later. Figures from 1890 to 1940 come from the decennial census and are spaced ten years apart; annual estimates begin in 1947 with the Current Population Survey. The early portion of the line therefore interpolates between decade points, a standard practice that smooths year-to-year detail before 1947.
Common misinterpretations
Reading the record high as a break with tradition. Men’s 2025 figure is the highest in the series, and women’s sits just below their 2021–2024 peak; neither is a departure from a historical norm of young marriage. No such norm appears in the record since 1890. The mid-1950s low is the genuine outlier; the present sits at the upper end of a long-run range that already reached into the mid-twenties in the 1890s.
Treating later marriage as identical to less marriage. The two often move together, but the median age series measures only the first. Conclusions about whether Americans marry at all require separate data on lifetime marriage rates.
Assuming the chart assigns a cause. The line shows when first marriages occur, not why. Attributing the trend to a single factor — economic pressure, cultural change, or any other — goes beyond what an age series can support.
Methodology and sources
Primary source. U.S. Census Bureau, Table MS-2, “Estimated Median Age at First Marriage, by Sex: 1890 to Present.” Figures for 1890–1940 are from the decennial census; figures from 1947 onward are from the Current Population Survey, Annual Social and Economic Supplement. Retrieved June 2026.
Definition. The median age at first marriage is the age by which half of all first marriages have taken place, estimated for men and women separately.
Supporting figure. Mean age of mother at first birth (21.4 in 1970, 27.5 in 2023) is from the CDC/National Center for Health Statistics, National Vital Statistics System. It is provided as context and is not part of the charted series.
Note on coverage. Beginning in 2019, Census estimates include same-sex married couples. Early-period values are decennial and are connected by interpolation in the chart; annual detail begins in 1947.
Reproducibility. The full year-by-year series for men and women is available below as a CSV. The chart is generated with Python (pandas, matplotlib).
Frequently asked questions
What is the average age of first marriage in the U.S. today?
In 2025 the median age at first marriage was 30.8 years for men — the highest in records that begin in 1890 — and 28.4 years for women, just below the 28.6 they reached in 2021–2024, according to the U.S. Census Bureau.
When did Americans marry youngest?
In the mid-1950s. The lowest medians on record were reached in 1956: 22.5 years for men and 20.1 for women. Those ages were younger than the 1890 figures (26.1 and 22.0), which is why the post-war decade reads as an exception rather than a baseline.
Is marriage age still rising?
Yes. The median has risen, with minor fluctuations, from the mid-1950s low: men reached a record 30.8 in 2025, while women, at 28.4, sit just below their 2021–2024 peak of 28.6. The rise in women’s age has outpaced men’s, narrowing the gap between them from about 4.1 years in 1890 to 2.4 years in 2025.
Does a higher marriage age mean fewer people marry?
Not necessarily. The median age and the share who ever marry are distinct measures. A rising median is consistent with later marriage, with less marriage, or with both; the age series alone cannot separate them.
Why are Americans marrying later?
There is no single agreed answer. Some analyses emphasize economic constraints such as housing costs and student debt; others emphasize expanded options, including rising educational attainment, women’s labor-force participation, and the spread of cohabitation. The age data document the trend without settling the explanation.
Download the dataset
Median age at first marriage, men and women, United States, 1890–2025, with source per row.
Source: U.S. Census Bureau, Table MS-2. U.S. federal government data in the public domain; cite the U.S. Census Bureau as the source.
Conclusion
The record of first-marriage ages in the United States, which begins in 1890, contains one genuine outlier, and it is not the present. Median ages reached their lowest recorded values in the mid-1950s and have climbed back to 30.8 years for men — a record — and 28.4 for women in 2025, both above the levels of the 1890s. Read against the full series, today’s late marriages are the high end of a long-run range rather than a break with a tradition of marrying young — a tradition the data place, narrowly, in a single post-war generation.
Why the line has risen since the 1950s is a separate question, and one the age series leaves open. Is the modern delay better understood as constraint — the rising cost of forming a household — or as choice, the product of expanded education, work, and living arrangements? The same numbers support both readings, which is what makes them worth examining rather than assuming.
This page presents publicly available demographic data for informational and educational purposes only. It does not constitute financial, investment, or personal advice.
Last updated — 8 October 2026
Disclaimer – Financial and Legal Information: The analyses, commentary, and content published on eco3min.fr are provided for informational and educational purposes only. They do not constitute investment advice or a solicitation to buy or sell financial instruments. Past performance is not indicative of future results. All investment decisions involve risk and are the sole responsibility of the reader. Data, charts and calculated series are provided as is and may contain errors or lag behind their source: check any figure against the primary source cited before relying on it. Content describing laws, regulations or contracts reflects the law as of its publication date and does not constitute legal or tax advice; applying it to a specific situation requires a qualified legal or tax professional.
Data on this page: the series are collected automatically from the sources cited, then formatted or calculated by Eco3min (units, frequency, derived calculations). They may differ from the official release because of producer revisions, update lags, rounding or processing errors. They are provided as is, with no warranty of accuracy, completeness or timeliness. Before any professional, contractual or regulatory use, and before any financial decision, check the values against the primary source. To the extent permitted by law, the publisher accepts no liability for the consequences of using these data without that check.