
Minutes of work to afford a Big Mac: 16 OECD economies, 2026
How long you work to afford a Big Mac
16 OECD economies, 2026 · net average wage. Switch the view: the order changes, because the dollar price doesn't track the work-time.
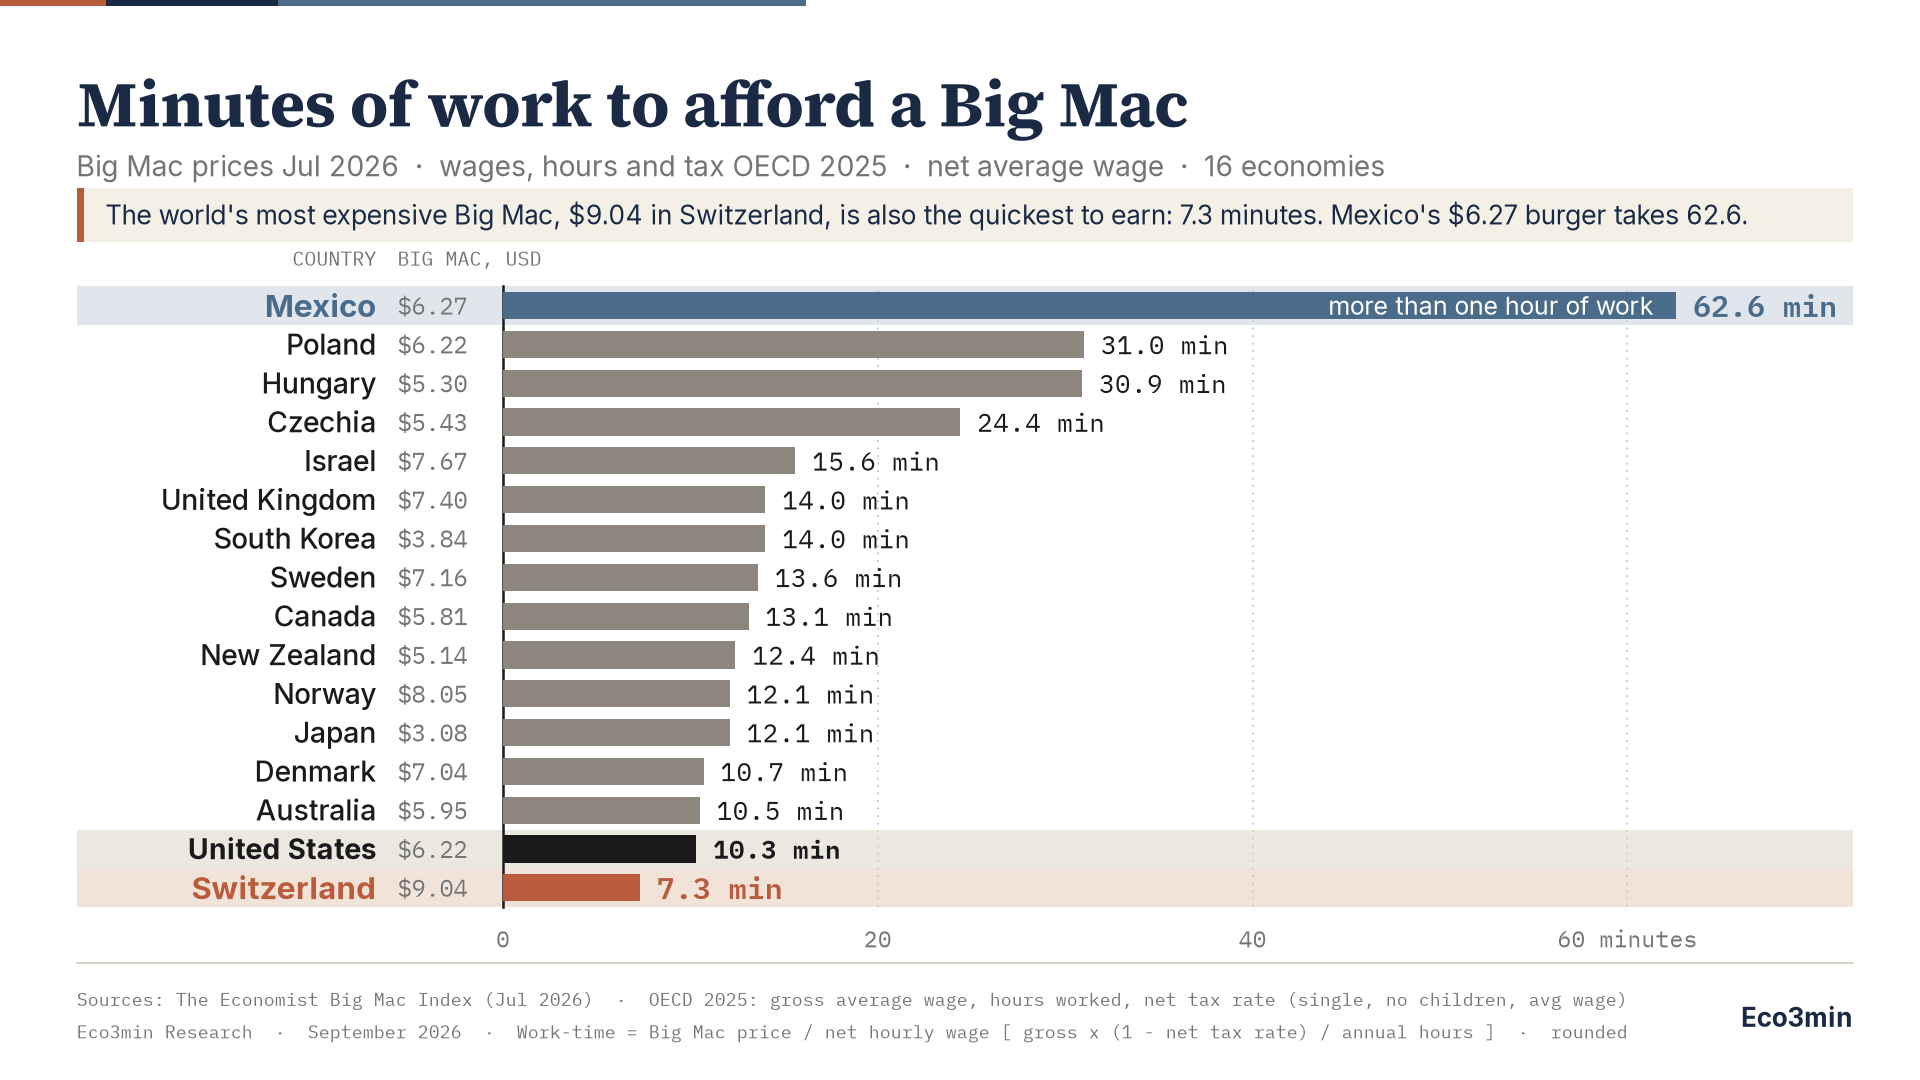
TL;DR. Measured in minutes of work at the average net wage, a Big Mac costs about 7 minutes in Switzerland and about 63 in Mexico across 16 OECD economies in 2026, a gap of more than eight times. The striking part is that the dollar price barely predicts the work-time: Switzerland has the world’s most expensive Big Mac ($9.04) yet earns it fastest, while a cheaper burger in Mexico ($6.27) takes more than eight times as long. Wages, not prices, do almost all of the work.
The Big Mac Index was designed to compare currencies. This page uses it for something else: holding the burger constant as a single standardized product and asking how long the average worker has to work to buy one, on net (take-home) pay, across 16 OECD economies in 2026. The result is a spread of more than eight times, from about 7 minutes in Switzerland to about 63 minutes in Mexico, and a pattern in which the sticker price of the burger turns out to be a poor guide to how much work it actually costs.
The underlying dataset, including each country’s burger price, average wage, annual hours, net tax rate and the computed work-time, is available for download below. The narrow point established by the data is that across this set of high- and middle-income economies, work-time to afford a standardized good is driven overwhelmingly by net hourly wages rather than by the local price of the good itself.
Key figures at a glance
Scope: 16 non-euro OECD economies; Big Mac prices July 2026, wages, hours and tax OECD 2025
Metric: minutes of work to afford one Big Mac, at the average net (take-home) wage
Fastest: Switzerland, ≈7.3 minutes (burger price $9.04, the most expensive in the world)
Slowest (of this set): Mexico, ≈62.6 minutes (burger price $6.27)
United States: ≈10.3 minutes ($6.22)
Cheapest burger (of this set): Japan, $3.08, yet ≈12.1 minutes (slower than the US)
Spread: ≈8.6× between the fastest and slowest in the set
Sources: The Economist Big Mac Index (Jul 2026); OECD average wages, hours worked and Taxing Wages (2025). Eco3min calculation.
A standardized burger, very different amounts of work
The Big Mac has one useful property for cross-country comparison: it is, as far as any consumer good can be, the same product everywhere. The ingredients, the preparation and the brand are standardized, which is precisely why The Economist has used it since 1986 as a rough gauge of currency valuation. Holding that product constant and converting its price into working time produces a clean question (how long does the average worker labour for one identical item) that strips out the noise of differing consumption baskets.
Across the 16 OECD economies covered here, the answer ranges by close to an order of magnitude. At the 2025 average net wage and July 2026 prices, a Big Mac costs approximately 7.3 minutes of work in Switzerland, 10.3 minutes in the United States, and between roughly 10.5 and 16 minutes across a broad cluster of high-income economies including Australia, Denmark, Norway, Japan, Canada, New Zealand, Sweden, the United Kingdom, Israel and South Korea. The middle-income members of the set sit well above that band: about 24 minutes in Czechia, 31 in Hungary and Poland, and about 63 in Mexico. The gap between the fastest and slowest economy in the set is more than eightfold. An eightfold gap on the same sandwich is the kind of order of magnitude that gives everyday financial trade-offs tied to the macro backdrop their substance.
This is, in one sense, unsurprising: higher net hourly wages buy a fixed-price good with less working time. What is less obvious is how little the burger’s own price contributes to the ranking, which is the subject of the next section.
The dollar price barely predicts the work-time
If the local price of a Big Mac determined how hard it was to afford, the ranking by price and the ranking by work-time would line up. They do not. Three observations make the disconnect concrete.
Switzerland has the most expensive Big Mac in the world and earns it the fastest. At $9.04 (CHF 7.30), the Swiss burger is the single most expensive in The Economist’s July 2026 dataset, more expensive than anywhere else on the planet. Yet at the Swiss average net wage, it takes only about 7.3 minutes to earn, the shortest of any economy in this set. The world’s priciest burger is also its quickest to work for.
A cheaper burger in Mexico takes more than eight times as long. Mexico’s Big Mac costs $6.27, nearly three dollars less than Switzerland’s, but at the Mexican average net wage it takes roughly 63 minutes to earn. That is more than eight times Switzerland’s working time for a cheaper product. (This is the longest work-time of the 16 OECD economies shown; many lower-income countries outside the OECD would sit higher still, since their cheaper sticker prices do not come close to offsetting lower wages.)
The cheapest burger in this set is not the quickest to earn. Japan has the lowest-priced Big Mac of the 16 economies here, at $3.08 (JPY 500), about a third of the Swiss price. Yet it takes about 12.1 minutes of work, longer than the United States’ $6.22 burger at 10.3 minutes, because Japanese net hourly pay is lower. A burger that costs half as much can take more work to afford.
Put together, the dollar price and the work-time are only loosely related. Across this set, the price a consumer sees is a weak signal of the effort the same item represents; the binding variable is net pay per hour, not the price tag.
What actually drives the gap
Three inputs determine the work-time for each country, and they pull in the same direction for the middle-income members of the set. The first is the net hourly wage: the average gross wage, less the share taken by income tax and employee social contributions, divided by hours worked. The second is annual hours worked, which vary considerably, from roughly 1,350 hours per year in Switzerland, Denmark and Norway to about 2,300 in Mexico. A longer working year mechanically lowers the hourly wage for a given annual salary, so economies that work more hours per year for lower annual pay face a double penalty in work-time terms. The third is the net tax rate, which reduces take-home pay and therefore lengthens the work-time; it ranges from about 13% for a single Mexican worker at the average wage to about 35% in Denmark.
The burger’s own price is the fourth input, and the one that matters least to the ranking. Because net hourly wages differ across this set by far more than burger prices do (roughly threefold in dollar price versus an order of magnitude in net hourly pay), wages dominate the outcome. This is why the price-based and work-time-based orderings come apart.
Methodology and sources
Primary metric. Minutes of work to afford one Big Mac, computed in each country’s national currency to avoid exchange-rate distortion:
minutes = Big Mac price (local) ÷ [ gross average wage × (1 − net tax rate) ÷ annual hours ] × 60
Big Mac prices. The Economist Big Mac Index, July 2026 release (local-currency and US-dollar prices). The four largest and smallest values in this set are Switzerland ($9.04), Norway ($8.05), Japan ($3.08) and South Korea ($3.84).
Wages, hours and tax. OECD, 2025 (the latest year available for all three series). Gross average annual wage from the OECD Average annual wages dataset (current prices, national currency). Average annual hours worked per employee from the OECD hours-worked dataset. Net personal average tax rate (income tax plus employee social security contributions) from OECD Taxing Wages, for a single person with no children earning 100% of the average wage.
Why net rather than gross. A worker buys a burger with take-home pay, so net is the appropriate basis. It also aligns with the familiar “working time to afford” comparisons. Using gross pay would shorten the times most in high-tax economies and is not used here.
Why these 16 economies. Only non-euro OECD members are included. The Economist publishes a single Big Mac price for the entire euro area rather than per country, so applying one price to Germany, France, Spain and others individually would be an unverifiable assumption. Of the remaining non-euro members, Iceland has no Big Mac price (there has been no McDonald’s in Iceland since 2009), and Chile, Colombia, Costa Rica and Türkiye do not yet have a 2025 value in the OECD average-wage series (their latest is 2023 or 2024). Pairing an older wage with a 2026 burger price would distort the work-time, most obviously for Türkiye given its inflation, so the set is limited to the 16 countries where wages, hours and tax are all available for 2025.
Limitations. (1) Burger prices are July 2026 while wages, hours and tax are 2025 annual averages; nominal wages rose somewhat between 2025 and July 2026, so the work-times are very slightly overstated, broadly uniformly across countries, and the ranking is robust. For Israel the 2025 hours figure is total employment rather than employees only, the latter not yet being published; the difference is about 1.5%. (2) The average wage is a full-time-equivalent figure and hours are the average across all employees, so the hourly wage is an approximation; this matters most in heavy part-time economies, which are euro members excluded here. (3) The net tax rate reflects one household profile (single, no children, 100% of the average wage); other households would have different take-home pay. (4) The Big Mac is a single standardized branded good with local rent and labour priced in, not a cost-of-living index.
Reproducibility. The full dataset, each country’s local and dollar burger price, gross average wage, annual hours, net tax rate, net hourly wage and computed work-time, with the source for each input, is available below as CSV. The chart is produced with Python (matplotlib).
Common misinterpretations
Reading Mexico as “the most expensive Big Mac in work-time terms, globally.” Mexico has the longest work-time of the 16 OECD economies in this comparison, not of all countries. Outside the OECD, lower-income economies generally face longer work-times for a Big Mac, because their lower sticker prices do not offset their lower wages. This page is an OECD-only comparison by design.
Reading Japan’s low price as low effort. Japan has the cheapest Big Mac of this set in dollar terms ($3.08), but a below-average net hourly wage means it still takes about 12.1 minutes, longer than the United States. A low price does not imply a short work-time.
Treating the figures as gross-wage minutes. The work-times here are computed on net (take-home) pay. On a gross basis the times would be shorter, and shorter by the most in high-tax economies such as Denmark and Norway. The net basis is what makes the figures comparable to everyday “minutes of work to afford” intuition. Everyday intuition of that kind is where the Financial Education pillar starts, before any interest rate enters the picture.
Treating the Big Mac as a cost-of-living index. The Big Mac Index works because the product is standardized, which makes it a clean apples-to-apples object, but it is a single branded good, not a representative consumption basket. It is best read as a rough real-wage probe, not a measure of overall cost of living.
Frequently asked questions
Why use net wages instead of gross?
Because a worker pays for a burger out of take-home pay, not gross pay. Net is computed as the gross average wage less the OECD’s net personal average tax rate (income tax plus employee social contributions) for a single person with no children at 100% of the average wage. Using gross would shorten the work-times, most of all in high-tax economies, and would be less comparable to the familiar “working time for a Big Mac” figures.
Why is the United States about 10.3 minutes and not the figure I have seen elsewhere?
This is the same idea: published estimates of this kind (for example UBS’s “prices and earnings” series) are also computed on net pay, so they are comparable in principle. The exact number moves with the wage source and the year; here it is OECD’s economy-wide average wage and average annual hours for 2025, and the result can differ from other published estimates.
Why are Germany, France and the eurozone missing?
The Economist publishes one Big Mac price for the whole euro area, not one per country. Splitting that single price across Germany, France, Spain and the rest individually would be an assumption that cannot be verified, so only non-euro OECD economies, each with its own local burger price, are included. Five non-euro members are also out: Iceland has no Big Mac price, and Chile, Colombia, Costa Rica and Türkiye have no 2025 wage figure yet at the OECD.
Does this mean a Big Mac is “unaffordable” in middle-income countries?
The page measures working time, not affordability judgments. About 63 minutes of work for a Big Mac in Mexico is a descriptive fact about relative net wages and a fixed-price good; what counts as affordable is a separate question that depends on incomes, frequency of purchase and local alternatives.
Is work-time a better cross-country comparison than PPP-adjusted income?
Each captures something different. Work-time to buy a single standardized product is intuitive and avoids choosing a consumption basket, but it reflects one branded good. Purchasing-power-parity income adjusts for a broad basket but depends on how that basket is defined. The two are complementary rather than substitutes.
Download the complete dataset
Every country’s local and dollar Big Mac price, gross average wage, annual hours, net tax rate, net hourly wage and computed work-time, with the source for each input.
Source: eco3min.fr · The Economist Big Mac Index (data under CC BY 4.0, github.com/TheEconomist/big-mac-data), OECD.
Conclusion
Across 16 OECD economies in 2026, the working time required to afford a single standardized Big Mac spans close to an order of magnitude, about 7 minutes in Switzerland to about 63 in Mexico, at the average net wage. The more revealing pattern is the weakness of the link between the burger’s price and its work-time cost: the world’s most expensive Big Mac is the quickest to earn, a cheaper burger can take more than eight times as long, and the lowest-priced burger in the set is not the fastest to afford. Net hourly wages, hours worked and tax do almost all of the explaining; the price tag does very little.
The figures are a descriptive placement of relative real wages against a fixed object, not a cost-of-living index or a judgment about affordability. The dataset and method are designed to be updated as new Big Mac and OECD figures arrive.
Last updated — 6 October 2026
Disclaimer – Financial and Legal Information: The analyses, commentary, and content published on eco3min.fr are provided for informational and educational purposes only. They do not constitute investment advice or a solicitation to buy or sell financial instruments. Past performance is not indicative of future results. All investment decisions involve risk and are the sole responsibility of the reader.
Data, charts and calculated series are provided as is and may contain errors or lag behind their source: check any figure against the primary source cited before relying on it.
Content describing laws, regulations or contracts reflects the law as of its publication date and does not constitute legal or tax advice; applying it to a specific situation requires a qualified legal or tax professional.