Real Estate’s True Cycle Is Credit, Not Prices
Property prices act as a lagging, fragmentary indicator. The real estate cycle is, first and foremost, a credit cycle—governed by lending standards, the real cost of capital, and the selectivity of financing.

TL;DR
French mortgage origination fell roughly 40% between its 2022 peak and end-2024 while Notaires-INSEE prices slid only 5-10%, exposing a cycle driven by credit conditions that prices register late.
- The ECB Bank Lending Survey recorded euro-area banks tightening household mortgage standards for eight consecutive quarters between Q3 2022 and Q4 2024, thinning credit well before valuations adjust.
- The euro-area real policy rate turned positive in H2 2023 for the first time since 2011, reaching about 1.5-2% in 2024, reshaping banks' trade-off between balance-sheet expansion and capital protection.
- When credit contracts the market does not fall, it excludes: transaction scarcity and downward price stickiness let prices hold while the buyer base narrows to solvent participants, leaving departures with no statistical footprint.
Introduction — The Blind Spot of Price Indices
Periodically, real estate statistics arrive to reassure markets. Prices hold up, declines remain marginal, national indices show no major inflection. Many analysts conclude that the property cycle remains intact, that the anticipated correction has been digested, or that it will not occur.
That interpretation is fundamentally wrong.
This reading aligns with the analytical framework developed by central banks and macroeconomic institutions since the 2022–2024 monetary tightening, which highlighted the determining role of financing conditions in real estate market dynamics.
It stems from a persistent confusion between observed prices and the economic reality of the market. In real estate, even more than in other asset classes, prices are a lagging, fragmentary, and frequently misleading indicator. They capture completed transactions, concluded by a minority of solvent buyers, within a specific regulatory and banking context. They reveal only marginal information about the system’s actual health. Related work: our analysis of investing in real estate.
The driver of this system is neither demographic change, nor the housing shortage, nor even the level of rates considered in isolation. It is credit.
The real estate cycle is not, first and foremost, a price cycle. It is a financing cycle. And when this cycle reverses, valuations can long mask the actual deterioration of the market.
This logic is developed in a structured manner in the reference analysis dedicated to the credit cycle as the true real estate market cycle, which shows why financing access systematically precedes price adjustments.
This analysis is part of a broader view of real estate as a macro-financial asset, where rate cycles, financing-access conditions, and monetary constraints exert decisive influence well beyond price movements alone, as set out in the pillar page: Real Estate, Rate Cycles, and the Economy.
This analysis rests on the distinction between price indicators (completed transactions, measured by Notaires-INSEE indices in France) and financing indicators (supply, cost, and credit standards, documented by ECB bank lending surveys and Banque de France monetary statistics). The data cited come from these institutions’ publications.
The Mirage of Aggregated Data
Conventional real estate diagnostics rely on averages: valuation indices, national transaction volumes, average mortgage rates, housing starts. These statistics offer a descriptive picture but fail to capture the essential point: the market’s internal fragmentation.
This divergence between price indicators and underlying market dynamics is documented in official statistics: according to Banque de France data, French household mortgage origination fell by approximately ≈40% between the 2022 peak and end-2024, while Notaires-INSEE price indices over the same period showed only a decline of ≈5 to 10% depending on the segment.
In a financialized economy, real estate no longer operates as a consumer good exchanged among households with comparable profiles. It has become an asset whose accessibility depends on the banking system’s lending capacity, prevailing prudential standards, the effective cost of capital, and financial institutions’ risk appetite. (a neighbouring reading: the rate, duration and income equation behind borrowing power).
Averages conceal growing divergences: between first-time buyers and acquirers with existing wealth, between liquid markets and peripheral territories, between projects that can be financed and operations that are theoretically viable but inaccessible to bank credit.
Some argue that the structural housing shortage alone would sustain prices indefinitely. This argument misses a decisive point: in the absence of available and affordable credit, supply scarcity does not generate transactions but a paralyzed market reserved for an ever-narrower share of buyers.
This heterogeneity does not appear in price indices. Yet it constitutes the leading signal of a cycle reversal.
The Real Estate Credit Cycle: Defining a Key Concept
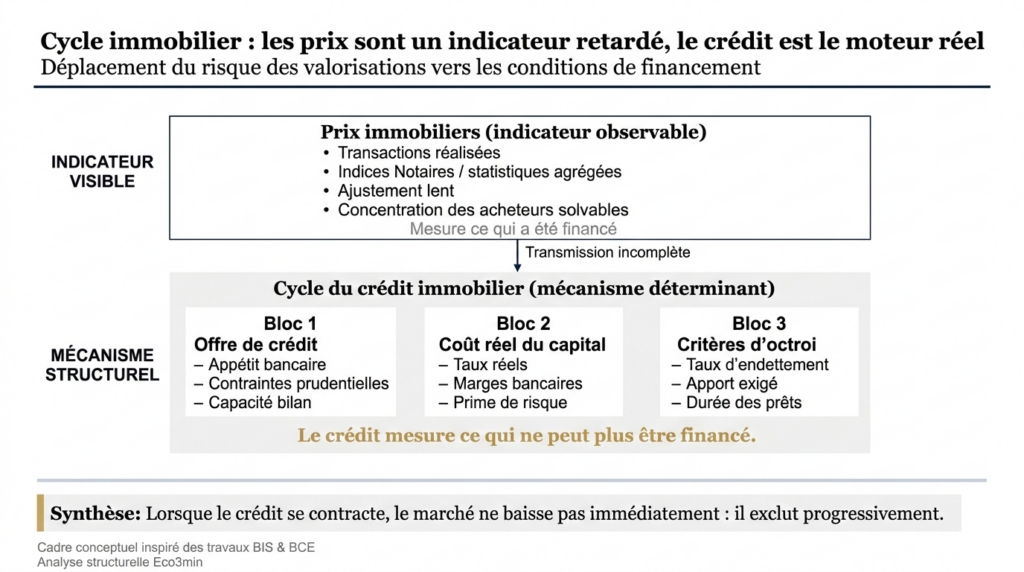
The real estate credit cycle refers to the joint evolution of three variables: credit supply, its real cost, and the eligibility criteria imposed on borrowers. This structural mechanism is treated in depth in the dedicated sub-pillar on the real estate credit cycle.
Contrary to a widespread idea, this cycle does not align with the trajectory of nominal rates. It results from the interplay of real rates, lender margins, capital requirements, prudential regulation, and banks’ perception of systemic risk.
Credit does not unfold linearly. It operates through successive regimes. In expansion phases, it grows faster than prices, fuels demand, and supports activity. In contraction phases, it gradually thins out, well before valuations adjust.
This growing selectivity is measured by the ECB’s Bank Lending Survey: between Q3 2022 and Q4 2024, euro area banks continued to tighten lending standards on household mortgages for eight consecutive quarters, according to the quarterly survey results.
Price statistics measure what has been financed. The credit cycle measures what can no longer be.
The reasoning is spelled out in the detailed analysis of the real estate credit cycle as the true driver of property prices , which demonstrates why real estate adjustments transit first through financing before manifesting in valuations.
Macroeconomic Late Cycles: Fertile Ground for This Phenomenon
Macroeconomic turns rarely announce themselves through a violent, immediate shock. They settle in through a gradual tightening of financial conditions.
When the cost of capital rises sustainably, even in the absence of a declared recession, several mechanisms engage: risk-adjusted profitability deteriorates, financing maturity becomes a vulnerability factor, and default exposure increases.
Real policy rates occupy a central position here. When they remain in positive territory for an extended period, they fundamentally alter banks’ trade-off between balance-sheet expansion and capital protection.
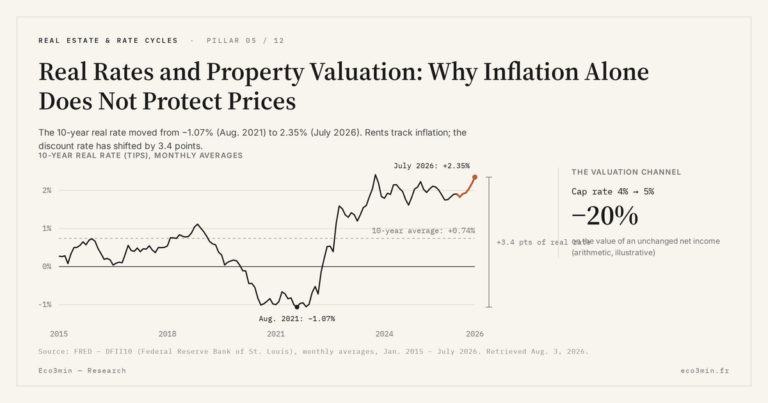
According to ECB-published data, the euro area’s real policy rate (refinancing rate adjusted for core inflation) returned to positive territory in the second half of 2023 for the first time since 2011, reaching a level of approximately ≈1.5 to 2% in 2024—a qualitatively different monetary regime from the previous decade. Real estate’s capacity to function as an inflation hedge under this positive-real-rate regime is analyzed in the sub-pillar dedicated to real estate and inflation.
At this stage of the cycle, credit does not evaporate. It becomes selective, then discriminating. That is precisely the shift price indices cannot detect.
A Mechanism Observable Beyond Real Estate
This logic is not specific to real estate. It is also observable in equity markets when performance dispersion widens and corporate results cease to move in concert.
This decoupling between synthetic indicators and underlying reality extends well beyond real estate. It also manifests in equity markets, where index performance can remain elevated even as the operational dynamics of companies fragilize. This illusion of solidity, born of aggregation and flow concentration, is examined in depth in our study on the growing decoupling between equity indices and corporate performance, which highlights how markets can display apparent stability while entering a regime of latent fragility.
The market can display surface stability while its internal structure unravels.
The same lens applies to real estate: aggregate prices hold, but the transactional base contracts. Solvent participants concentrate the bulk of activity. Others leave the market without leaving a statistical footprint.
This decoupling is analyzed in the following pillar article: Earnings Surprises and the Equity Cycle.
Anatomy of Credit Withdrawal: A Sectoral Dynamic
Credit withdrawal never occurs uniformly. It begins at the edges of the market: first-time buyers with limited down payments, leverage-dependent investors, structurally illiquid areas.
It then gradually reaches the core.
Banks adjust their criteria in successive increments: maximum loan duration, debt-to-income ratio, required collateral level, the nature of income recognized. Our decoding of REIT leverage draws out the consequences for listed property.
Taken together, these adjustments produce a cumulative contraction.
The Price Paradox: Apparent Stability, Contracting Market
One of the most striking paradoxes of contemporary real estate lies in prices’ capacity to hold at elevated levels within a structurally weakened market.
Transaction scarcity, concentration of solvent demand, downward stickiness of listed prices, and the absence of immediate selling pressure explain this phenomenon.
When credit contracts, the market does not mechanically fall: it excludes.
The market continues to function, but for an ever-narrower circle of participants.
Scope and Limits of the Credit Cycle as an Analytical Tool
The real estate credit cycle is not a short-term price forecasting instrument. It cannot date a turning point or anticipate the magnitude of a correction.
What it does provide is an anticipatory reading of the risk regime.
This framework aims to qualify a macro-financial regime, not to formulate price expectations or allocation recommendations.
Implications for Investment Approaches
In an environment where credit becomes selective, real estate investment approaches built on simplifying assumptions lose their relevance.
Readability now takes precedence over optimization, and the soundness of the financial structure becomes as decisive as the acquisition price.
These dynamics intersect with those analyzed in: Real Policy Rates and Risk Assets.
Diagnosis of the Current Real Estate Regime
The current regime is characterized by sustainably constrained credit, normalized cost of capital, and increased segmentation of local markets.
This type of configuration can persist for several years.
The real estate cycle is governed by credit selectivity and the real cost of capital; prices remain a lagging indicator, unable to reveal the contraction of financing.
Conclusion — Toward a New Analytical Framework
This gradual shift of risk from prices to financing constitutes the missing interpretive key in many contemporary real estate diagnostics.
Real estate can no longer be properly read through its prices. The true cycle lies elsewhere: in the dynamics of credit.
Understanding this cycle distinguishes surface stability from structural fragility, and frames real estate as a financed asset rather than merely a valued one.
Last updated — 18 July 2026
Disclaimer – Financial Information: The analyses, commentary, and content published on eco3min.fr are provided for informational and educational purposes only. They do not constitute investment advice or a solicitation to buy or sell financial instruments. Past performance is not indicative of future results. All investment decisions involve risk and are the sole responsibility of the reader.
Read next
Full pillar →Cap Rate Spread: What Rental Yield Pays Over the 10-Year Treasury
A 5% cap rate sounds attractive. But 5% against what? A risk-free 10-year Treasury yields near 4.5% in…
US Rental NOI, Line by Line: What Net Operating Income Really Subtracts
A US rental yield is advertised gross: annual rent over price. Between that number and the income an…
Vacancy and Turnover: The Cost That Erodes a Landlord’s Real Return
A listing shows full rent, twelve months a year. The owner knows the gaps between tenants, the make-ready…