
Uranium Boom and Bust: Why Past Rallies Disappointed

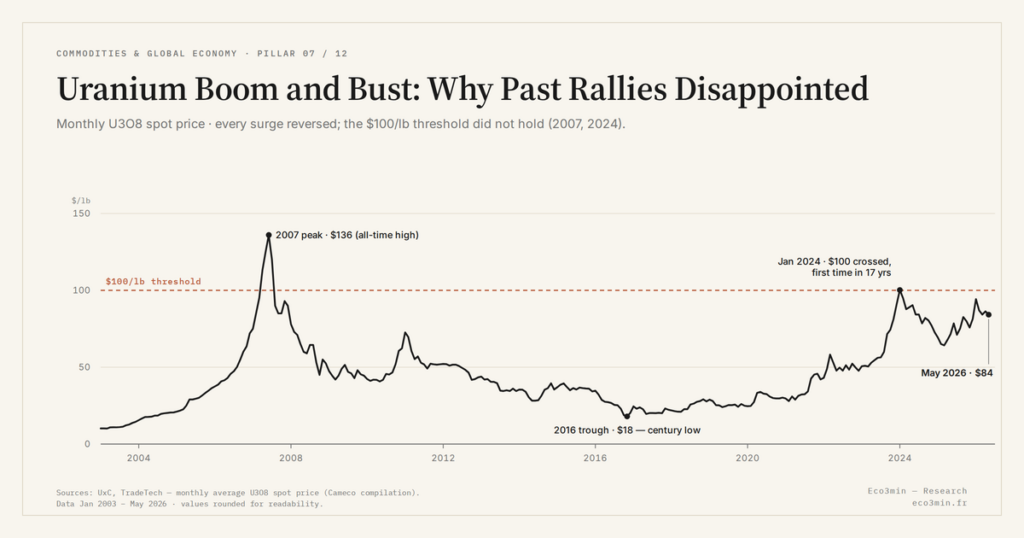
Uranium has a long history of boom-and-bust cycles: rallies thought durable have reversed, and the metal spent more than a decade in the doldrums after its 2007 peak, a precedent that invites caution.
TL;DR
Two features set uranium's current cycle apart from past busts: structural demand from compute rather than speculation, and the leading producer deliberately restraining output where earlier surges chased volume.
- Spot started 2007 near 72 dollars and peaked at 136 dollars that June, an all-time high, after a rise of more than 450 percent from early-2000s levels around 20 dollars.
- The March 2011 Fukushima accident reset national policies: Japan shut all 54 of its operating reactors and Germany 17, and utility inventories flowing back to the market saturated it, completing a nuclear exit by 2023.
- Spot crossed 100 dollars in 2007 and again in 2024 before falling back each time; on a thin, illiquid market, physical funds' buying can inflate a rally as their outflows deepen the decline.
This page retraces uranium’s past rallies and their disappointments, why its price reacts so much to sentiment, and what sets the current cycle apart from those that faded.
The 2007 peak and the long wilderness
The most striking precedent remains 2007. The uranium spot price, starting the year at about 72 dollars a pound, peaked at 136 dollars in June 2007, an all-time high, after a rise of more than 450 percent from its early-2000s level of around 20 dollars. Several forces fed the surge: expanding demand, major supply shocks such as the flooding of the Cigar Lake mine in late 2006, which deprived the market of expected output, and a marked dose of financial speculation. From trough to peak, the move was extraordinary even by commodity standards, which is part of why it drew so many late entrants convinced the climb would continue.
The excess was not confined to the metal. The 2007 rally fueled a genuine fever in producers’ shares, especially junior exploration companies, whose prices exploded on the back of the spot’s climb. The reversal hit them even harder than the commodity itself: lifted by the leverage of a promise, many lost most of their value when the price fell back, and never regained their highs. Uranium’s cycle thus replays, amplified, on the equities tied to it, compounding the disappointment of investors who entered at the top.
Every surge comes with a story that justifies it. In 2007, projections of strong growth in world nuclear demand served to rationalize ever-higher prices; those narratives, plausible on paper, did not prevent the reversal, because they were already embedded in a price that had risen too fast. The force of a bullish narrative says nothing about whether the price it accompanies will hold: the argument can be right and the entry level wrong, two things euphoria tends to conflate.
The collapse followed even before the accident that stays in memory. The 2008 financial crisis turned the move around: spot fell below 50 dollars in early 2009, then into the 40-dollar zone in 2010. Uranium’s first crash was therefore not caused by Fukushima, but by the macroeconomic reversal and the deflation of the speculation that had carried the peak. Those who had bought by extrapolating the 2007 rise watched their position depreciate for years.
Fukushima and the lost decade
By early 2011, uranium had recovered toward the low 70s, lifted by the rebound in energy metals. The Fukushima accident, in March 2011, broke that bounce cleanly. Japan shut down all fifty-four of its then-operating reactors and Germany its seventeen, accelerating a nuclear exit completed in 2023. A single accident on the other side of the world thus reset the policy of entire countries, and with it the demand outlook the market had been pricing. Utilities’ inventories, suddenly useless in the short term, flowed back to the market and saturated it.
The episode illustrates a recurring feature: uranium’s price answers to sentiment as much as to physical fundamentals. Reactors’ actual consumption did not fall overnight in the same proportion as the price; it was the anticipation of a curtailed nuclear future, combined with an influx of available material, that dragged the cash price down. A market where perception weighs as much as flows is by construction prone to overshooting, in both directions.
A long wilderness then opened. Spot slid toward 52 dollars in 2011, then continued a slow erosion until it touched a trough below 18 dollars in 2016, a level not seen since the start of the century, before struggling to break 25 dollars for three years. For a decade the sector contracted: investors were washed out after years of depressed prices, and many junior producers merged, were acquired or disappeared. The memory of that lost decade explains the durable caution of part of the market.
The 2024 rally, already faded
The recovery that began in 2021 and accelerated in 2023 culminated in a more recent episode. In January 2024, the spot price broke 100 dollars a pound for the first time in seventeen years, supported by the war in Ukraine and by strains on conversion and enrichment. But that push did not hold: the cash price fell back toward the 70-dollar zone in the following months. The scenario replayed in early 2026, when a brief break above 100 dollars gave way to a pullback toward 84 dollars. Here too, those who read the threshold break alone as the sign of a durable bull market were proven wrong in the short term.
These two recent surges shared a trait with the older ones: part of the rise owed to financial buying on a thin market as much as to utility demand. Physical funds returning to buy helped propel the cash price, and their fading accompanied the pullback. The repetition of the pattern, sixteen years apart, shows that a publicized break of a threshold says nothing, on its own, about the soundness of the move that carries it. Each time, the round number made the headline; what it omitted was how much of the move rested on flows that could reverse as quickly as they arrived.
Reading the break of a round threshold, such as 100 dollars, as the sign of an established bull market repeats the error of past cycles. Each time spot crossed that level, in 2007 as in 2024, it then fell back. Uranium’s cash price is driven by sentiment and overshoots: a threshold is not a trend.
Why the price overshoots
Uranium’s volatility owes to the nature of its market. Its price is closely coupled to sentiment, and the cash market, thin and illiquid, amplifies moves. On a market where a few million pounds can move the quoted price, the gap between a genuine shift in utility demand and a wave of financial buying is easily blurred, especially while the price is still climbing and every move looks like confirmation. It is on this narrow market that physical funds operate, whose effect is analyzed in connection with the role of physical funds in spot: their buying can inflate a rally, their outflows deepen a decline. A single event, an accident or a shift in energy policy, is moreover enough to erase years of gains, as Fukushima showed.
There is also a reflexive effect. On a shallow market, a rising price attracts additional buyers, whose orders push the price further, which appears to validate the trend and draws in others. This self-reinforcing mechanism works both ways: when the flow reverses, the decline calls forth sales that deepen the decline. It is this dynamic, more than fundamentals alone, that gives uranium’s cycles their amplitude and brutality.
One fact, however, qualifies the picture: the long-term contract price held up better than spot in every collapse. At the 2014 trough, while the cash price fell below 30 dollars, the contract price held around 45 dollars. This divergence, detailed in connection with the divergence between spot and contract, is a reminder that it is the cash price, not the contract, that carries most of the excess on the way up as on the way down. Reading the disappointment of past rallies through spot alone overstates the cycle’s real amplitude, since the contract, reflecting the commitments of utilities reasoning over time, is less prone to panic than cash-market participants.
What sets this cycle apart, without predicting it
Past rallies were often carried by speculation or by temporary supply shocks, quickly absorbed. The current cycle shows features the previous ones lacked: a demand whose nature is changing, fed by the structural demand from compute, and a supply discipline, the leading producer deliberately restraining its output, absent from earlier surges where producers instead sought to maximize volumes. These differences guarantee no outcome: the history of disappointments is real, and nothing ensures this cycle escapes it. What can be said is narrower: a structural demand shift is harder to unwind than a one-off supply scare, and a producer holding back output behaves differently from one racing to sell. Whether that is enough to break the historical pattern is exactly what cannot be asserted in advance.
The lesson is therefore neither that this rally will collapse like the others, nor that this time everything is different. It is to hold both elements together: a record of overshooting and reversals on one side, and new structural factors on the other, whose respective weight remains to be verified over time. This perspective sits within the overall case for uranium, falls under the cycles of physical resources, and joins the wider dynamic of the price cycle of commodities. The past is not a verdict on the future; it is a warning about how readily a rally is read as a trend, and about the real cost, borne by late entrants in prior cycles, of having confused the two.
Last updated — 22 September 2026
Disclaimer – Financial Information: The analyses, commentary, and content published on eco3min.fr are provided for informational and educational purposes only. They do not constitute investment advice or a solicitation to buy or sell financial instruments. Past performance is not indicative of future results. All investment decisions involve risk and are the sole responsibility of the reader.
Read next
Full pillar →Reading the refinery utilisation rate: the threshold, the season, the turnarounds
A refinery runs full near ninety percent, not a hundred: the last slice of nameplate capacity is a…
IMO 2020: the regulatory shock that rewrote product spreads
An environmental rule on marine sulfur can move a refining spread more than a swing in crude. IMO…
The 2022–2023 refining golden age: anatomy of an episode
In 2022, refined fuel prices climbed faster than crude. That gap, measured by the 3-2-1 crack spread, reached…


