
Uranium vs Oil and Gas: A Distinct Macro Behavior

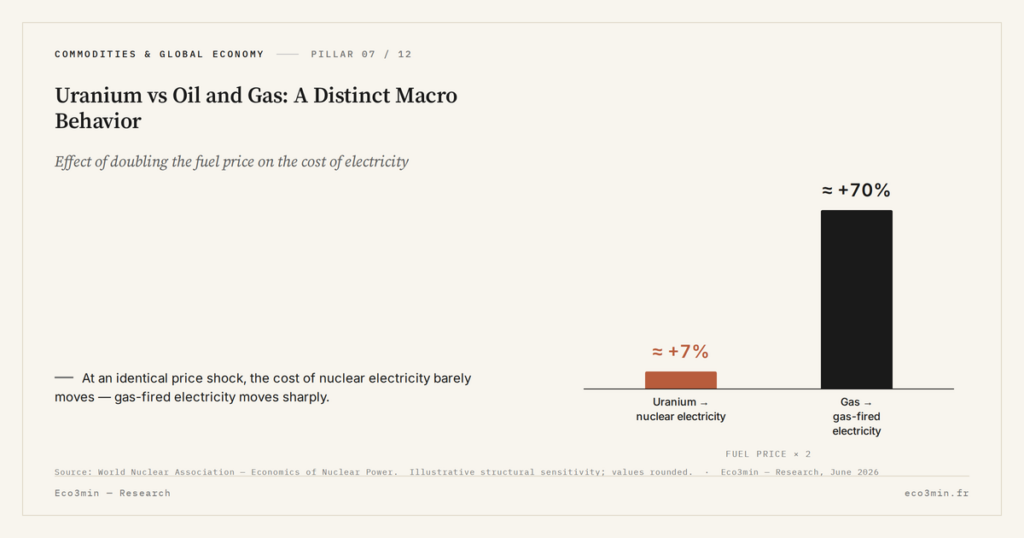
Uranium is often grouped with oil and gas under the “energy” label, but it behaves differently as a macro asset: its demand is insensitive to its price, barely tied to the cycle, and transmits almost nothing to inflation.
This page situates uranium relative to oil and gas: the structural differences in demand, market and macro transmission, and why treating uranium as an oil proxy misreads it.
A fuel that weighs little, demand insensitive to price
The most structural difference lies in the share of fuel in the cost of electricity. In a nuclear plant, fuel accounts for only about a fifth of the generating cost, and the uranium concentrate itself, before conversion, enrichment and fabrication, for only some 5 percent. The striking figure is this: a doubling of the uranium price raises the cost of nuclear electricity by only about 7 percent, whereas a doubling of the gas price adds nearly 70 percent to the cost of electricity from gas, where fuel makes up close to 90 percent of the total.
The consequence is decisive: utilities buy uranium whatever its price, because it weighs too little to change their decisions. Their demand is, in effect, insensitive to price, what economists call inelastic demand. Oil and gas demand, by contrast, responds to price: an expensive barrel triggers substitution, savings, even demand destruction. The reactor consumes the same quantity of uranium whether its price is fifty or one hundred dollars a pound. This breaks a link that holds for most commodities, where higher prices curb consumption: for uranium, the quantity demanded is set by the reactors running, not by the price paid for their fuel.
The way the material is sourced reinforces this indifference. A reactor holds several years of fuel and refuels only every eighteen to twenty-four months, in fractions of the core. Uranium is bought far in advance, and short-term fluctuations in its price are absorbed by fuel suppliers far more than by operators. Where a carrier or a manufacturer feels an oil increase immediately, the nuclear utility feels it only in muted and delayed form.
History confirms this. When the uranium price peaked in 2007 and 2008, the effect on nuclear fuel cost only materialized several years later, around 2009-2013, because the material had been bought well in advance and already sat in the reactors. The price spike thus passed through with a long lag and reduced magnitude, where an oil surge reaches the pump within weeks. This inertia is inherent to nuclear fuel: it accumulates in advance and is consumed slowly, which mechanically cushions price shocks.
The contrast across generating sources is stark: fuel makes up roughly four-fifths of the cost of a coal plant and nearly nine-tenths of a gas plant, against well under a fifth for nuclear once the uranium concentrate alone is isolated. No other major fuel matters so little to the price of the power it produces, which is why the link between the uranium market and the electricity bill is so faint.
An almost acyclical demand
The second difference is temporal. A nuclear plant runs as baseload, with a capacity factor above 90 percent, whether in a year of growth or of recession. Uranium consumption is therefore commanded by the fleet of operating reactors, a stock that evolves slowly with construction and closures, rather than by the business cycle. That underlying dynamic is developed in connection with the revival of nuclear demand, driven by projects whose horizon is measured in decades.
Oil obeys an altogether different logic. Its demand falls in recession, when there is less driving, flying and producing, and rebounds with activity; that is precisely what makes it a closely watched cyclical barometer. Uranium, by contrast, decouples largely from the growth cycle that animates oil: an economic slowdown does not close reactors and barely dents fuel consumption. Two materials filed under “energy,” but one cyclical and the other almost acyclical.
The gap shows in recessions. In a sharp downturn, oil consumption can fall by several points within months, as mobility and industrial production contract; this is the demand destruction that weighs on the barrel. Nothing of the kind for uranium: a reactor in service keeps producing as baseload, and the fleet consumes its fuel whether gross domestic product rises or falls. Uranium demand does not collapse in recession; it follows the slow path of plant construction and closure. A barrel of oil is therefore a real-time reading of activity, while a pound of uranium reflects a much slower variable, the size and age of the global reactor fleet, which a recession leaves essentially untouched.
A near-zero transmission to inflation
The third difference concerns the link to consumer prices. Oil feeds inflation directly: fuels, transport, input costs diffused throughout the economy make it a classic inflation channel, which the oil price as a cycle signal develops further. Uranium, by contrast, barely touches consumer prices: it is a minuscule input to electricity, and nuclear electricity is dominated by the cost of capital, not of fuel.
It follows that uranium does not transmit inflation the way oil does. Filing it among “inflation-hedge” commodities, alongside gold or oil, ignores this near-absent transmission channel. A surge in the uranium price does not appear in the price index; a surge in oil does. The distinction is not one of degree but of nature. For anyone reading macro data this matters: oil belongs among the prices that move the inflation print, uranium does not, and grouping them blurs which one actually carries into the cost of living.
Treating uranium as an oil proxy, or as an inflation hedge on the same footing, leads to misreading it. Its demand is insensitive to its price and almost acyclical, and its price transmits almost nothing to inflation. It is not the same macro asset, even though it carries the “energy” label.
Different markets and price formation
The very structure of the markets further separates uranium from oil and gas. The latter trade on deep, liquid futures markets that provide price discovery and let participants hedge. Uranium has no equivalent: its cash market is thin and most volumes pass through over-the-counter contracts, without a developed futures market, as uranium’s contract market analyzes. Its price forms from its own supply and demand, and from financial flows, more than from the oil cycle.
The use made of these markets diverges accordingly. An airline or a refiner hedges against the oil price by taking futures positions, a liquid and standardized instrument. The nuclear utility, by contrast, secures its supply through multi-year contracts negotiated directly with producers, not through a futures market. This difference in tooling is not trivial: it explains why uranium’s contract price, more stable, reports the underlying tension better than its cash price, while oil delivers a continuous, instantaneous signal through its futures quotes. One market is built for daily price discovery and short-horizon risk transfer, the other for securing physical supply years ahead; the instruments reflect what each commodity is for.
The physical volumes at stake also differ radically. One kilogram of natural uranium releases about twenty thousand times the energy of a kilogram of coal; the quantities needed are tiny and easily stockpiled. Uranium is not a flow material, transported in bulk and consumed continuously like oil, but a concentrated material that is stockpiled. That stockpilability is itself a divider: oil must be produced and consumed on a continuous flow, while years of uranium demand can sit idle in a warehouse, which is part of why financial holders can influence its price at all. Its volatility itself follows a boom-and-bust, sentiment-driven logic, distinct from oil’s broad cyclical swings, as past rallies and their reversals show.
It would be excessive to present uranium and hydrocarbons as strangers to one another. They share a geopolitical supply risk: a producers’ organization and the Middle East for oil, Kazakh, Russian and Nigerien concentration for uranium. Both are exposed to the energy-transition narrative, which can support or penalize their long-term demand. And both are commodities prone to cycles of enthusiasm and disillusion. Some investors indeed value uranium’s low correlation with the oil complex, which they read as a source of diversification. These shared traits are real, and an analyst who ignored them would also misjudge uranium; the point is not that the two have nothing in common, but that what they share is narrower than the label suggests.
Yet these commonalities should not obscure the essential point: the channels of macro transmission are not the same. The energy-transition exposure itself warrants a qualification, since the decarbonization narrative can work in opposite directions on the two families: it supports uranium, of which nuclear is a low-carbon pillar, while weighing over time on hydrocarbon demand. Situating uranium correctly means reading it on its own terms, from its inelastic demand, its reactor fleet and its contract market, rather than as an interchangeable member of the energy complex. That is the object of the overall uranium thesis, which falls more broadly under the analysis of physical commodity markets. Uranium is an energy material, but its macro behavior is its own; it is that behavior, not its label, one should rely on to read it correctly.
Last updated — 28 June 2026
Disclaimer – Financial Information: The analyses, commentary, and content published on eco3min.fr are provided for informational and educational purposes only. They do not constitute investment advice or a solicitation to buy or sell financial instruments. Past performance is not indicative of future results. All investment decisions involve risk and are the sole responsibility of the reader.
Read next
Full pillar →Reading the refinery utilisation rate: the threshold, the season, the turnarounds
A refinery runs full near ninety percent, not a hundred: the last slice of nameplate capacity is a…
IMO 2020: the regulatory shock that rewrote product spreads
An environmental rule on marine sulfur can move a refining spread more than a swing in crude. IMO…
The 2022–2023 refining golden age: anatomy of an episode
In 2022, refined fuel prices climbed faster than crude. That gap, measured by the 3-2-1 crack spread, reached…


