
US customs duties collected and refunded, March 2015 to July 2026
Source: U.S. Treasury, Monthly Treasury Statement, Table 4 (Receipts of the U.S. Government), Customs Duties line. March 2015 to July 2026. Current dollars, not seasonally adjusted.
TL;DR
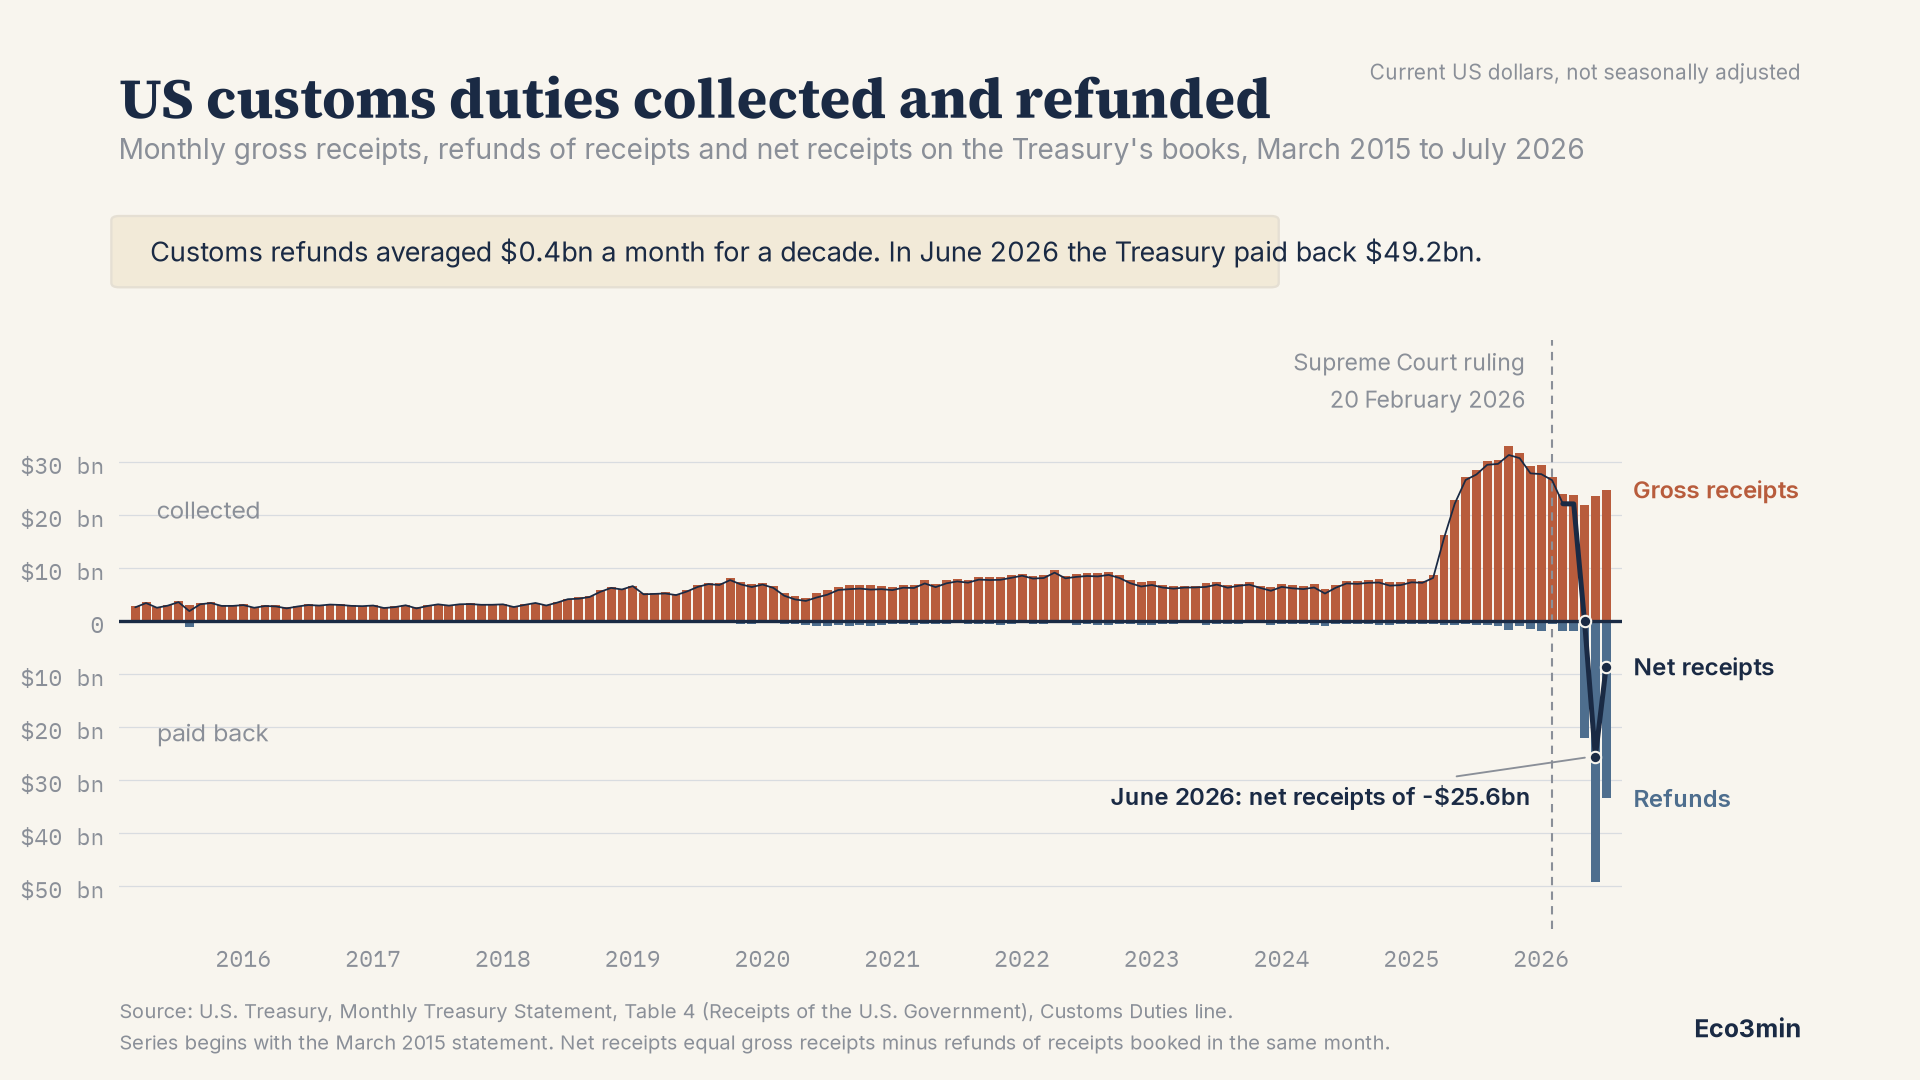
For the decade to March 2025, the US Treasury refunded an average of $0.385bn of customs duties a month, and never more than $1.09bn in any single month. In June 2026 it refunded $49.18bn. Net customs receipts, the line that actually enters the federal budget, went negative for three consecutive months: −$0.04bn in May, −$25.56bn in June, −$8.55bn in July. Importers did not stop paying. Gross collections over those same three months averaged $23.46bn a month, about four times the pre-2025 norm. The fiscal-year total for customs duties peaked at $188.6bn in April 2026 and stood at $154.5bn in July, having given back $34.1bn.
A federal revenue line turned into a payout line. Between May and July 2026 the customs duties row of the Monthly Treasury Statement, which had produced money every month for as long as the published series runs, produced negative numbers three times in a row. This page documents that using a single primary source, the US Treasury’s own monthly accounts, and makes the full 137-month series available for download.
The claim here is narrow and worth stating precisely. It is not that tariffs ended. Gross duties collected from importers remained close to $24bn a month throughout the episode. What ended, briefly, is the arithmetic by which those collections exceeded what the Treasury was simultaneously paying back. Gross receipts, refunds and net receipts are three different quantities, and the chart shows all three because the difference between them is the entire story.
Key Findings at a Glance
Source: US Treasury, Monthly Treasury Statement, Table 4 (Receipts of the U.S. Government), Customs Duties line
Coverage: 137 months, March 2015 to July 2026, current dollars, not seasonally adjusted
Average monthly gross receipts, March 2015 to March 2025: $5.77bn
Average monthly refunds, same window: $0.385bn (largest single month $1.09bn)
Peak gross month: October 2025, $33.09bn
Peak net month: October 2025, $31.35bn
Refunds, May to July 2026: $21.97bn, $49.18bn, $33.38bn
Net receipts, May to July 2026: −$0.04bn, −$25.56bn, −$8.55bn
Average monthly gross receipts, May to July 2026: $23.46bn (4.1× the pre-2025 average)
Fiscal 2026 customs receipts to date: $188.6bn in April, $154.5bn in July
Negative months in the published series: 3 of 137, all in 2026
What the chart measures
Every month the Treasury publishes, in Table 4 of the Monthly Treasury Statement, three figures for each source of federal revenue: gross receipts, refunds of receipts, and net receipts, which is the first minus the second. The customs duties row of that table is the whole of this dataset. Nothing here is estimated, deflated, seasonally adjusted or combined with another source, because the three quantities sit on the same row of the same document and the point of the chart is the gap between them.
Above the zero line, in terracotta, is what importers paid in the month. Below it, in steel blue, is what the Treasury paid back in the month. The navy line is the net, and it is drawn faintly for the years in which refunds were too small to separate it from gross receipts, then heavily from March 2026 when the two part company.
Refunds are booked in the month the Treasury certifies them, not in the month the duty was originally collected. That timing matters for reading the 2026 months and is discussed under limitations below.
The three negative months
The published series begins with the March 2015 statement. Across the 134 months from then to April 2026, net customs receipts were positive every month, running between $1.91bn in August 2015 and $31.35bn in October 2025. Refunds over that whole span never exceeded $1.74bn, the figure for October 2025; over the decade to March 2025 they never exceeded $1.09bn.
May 2026 broke that. Refunds of $21.97bn against gross receipts of $21.93bn produced net receipts of −$0.04bn, effectively zero. June went much further: $49.18bn refunded against $23.63bn collected, for net receipts of −$25.56bn. July returned $33.38bn against $24.83bn, for −$8.55bn. Those three months are the only negative readings in the series.
The effect on the fiscal year is visible in the running total. Customs receipts for fiscal 2026, which began in October 2025, stood at $117.7bn by the end of January and $188.6bn by the end of April. By the end of July they stood at $154.5bn. A cumulative total that falls is a total being paid back: $34.1bn of the fiscal year’s own receipts were returned in three months.
Collections did not stop
The most common misreading of a chart like this one is that the negative net months mean tariffs were switched off. The gross column says otherwise. Over May, June and July 2026 importers paid an average of $23.46bn a month in duties, against an average of $5.77bn a month over the decade to March 2025. Collections in the middle of the refund episode were running at roughly four times the pre-2025 level. Fourfold is the fiscal footprint of trade fragmentation and the reshaping of global supply chains, measured at the customs desk.
Independent measurement points the same way. The Penn Wharton Budget Model, in its update of 10 August 2026, puts the average effective tariff rate, computed as customs duties divided by the value of imports, at 7.1% in June 2026 against 2.3% in January 2025. That is well below the 10.3% the same series reached through January 2026, and roughly three times where it started. The same update reports gross tariff revenue of $283.9bn between January 2025 and June 2026, of which around $166bn was collected under the authority the Supreme Court struck down, and approximately $100bn of refunds certified through July 2026.
Two readings of the same data
The pattern admits two interpretations, and the Treasury series alone does not settle which carries more weight.
The first reading is that this is a timing artefact. Refunds are lumpy by construction: they are certified in batches, and a single quarter of processing can compress into one month what accrued over a year. On this reading the negative months say something about the administrative calendar of US Customs and Border Protection rather than about the fiscal position, and the meaningful number is the cumulative one, gross collections of $283.9bn against refunds of roughly $100bn over the same eighteen months, which remains substantially positive. The three negative months would then be an accounting shadow of a programme that still raised money.
The second reading is that the cash is the fact. A refund is not a bookkeeping entry; it is money leaving the Treasury General Account, and the federal deficit is measured in cash. Fiscal 2026 will record whatever net figure the year ends on, not the gross. On this reading the relevant comparison is between what the tariff programme was projected to raise and what the Treasury will keep, and the $34.1bn given back between April and July is a real subtraction from a real fiscal year. The Congressional Budget Office, in its Monthly Budget Review for August 2026, reported a deficit of $1.8tn over the first ten months of fiscal 2026. A deficit of that size is one of the fiscal markers of the regime shifts that separate the Great Moderation from the structural break.
Both readings are consistent with the chart. What neither disputes is the sign change: a revenue line that had never gone below zero in the published series went below zero three times in a row.
What this chart does not measure
It does not measure who bore the cost of the duties while they were being collected. The split between importers, foreign exporters and US consumers is an empirical question that customs receipts cannot answer, and it is contested.
It does not measure the effective tariff rate. Duties collected depend on the volume and composition of imports as well as on rates, and a month of falling collections can reflect either. The Penn Wharton series cited above is the right instrument for that question.
It does not identify which refunds correspond to which tariff authority. The Treasury row is a single aggregate. The attribution to the February 2026 ruling is a matter of timing and of the Penn Wharton and CBP figures cited above, not something the Treasury series states on its own.
It does not forecast. Refunds still owed, and the pace at which they are certified, determine what the remaining months of fiscal 2026 look like, and this page takes no position on that.
Method
The series is pulled directly from the Treasury Fiscal Data API, from the Monthly Treasury Statement Table 4 endpoint, filtered to the Customs Duties classification, and is used without transformation. Gross receipts, refunds of receipts and net receipts are the three fields as published. Figures in this article are stated in billions to two decimal places where the source gives cents; averages are simple arithmetic means over the stated months. The fiscal-year running total is the Treasury’s own fiscal-year-to-date field, which resets each October.
The published Table 4 series begins with the March 2015 statement. Statements about the whole series in this article are therefore statements about March 2015 onward, and are worded that way throughout. Customs duties existed and were recorded before 2015; this dataset does not cover them.
Download the full dataset (CSV, 137 months, with sources and method notes)
An open question
Every developed economy books tax refunds, and every one of them occasionally books a large one. What is unusual here is the ratio: a single month of refunds worth more than twice that month’s collections, on a revenue line that had run steady for a decade. Is that better understood as an administrative event, of the kind any tax authority produces when a large assessment is unwound, or as a fiscal one, of the kind that shows up in a deficit and stays there? The Treasury series is compatible with both, and the answer depends on which horizon the reader thinks is the honest one.
Last updated — 6 October 2026
Disclaimer – Financial and Legal Information: The analyses, commentary, and content published on eco3min.fr are provided for informational and educational purposes only. They do not constitute investment advice or a solicitation to buy or sell financial instruments. Past performance is not indicative of future results. All investment decisions involve risk and are the sole responsibility of the reader. Data, charts and calculated series are provided as is and may contain errors or lag behind their source: check any figure against the primary source cited before relying on it. Content describing laws, regulations or contracts reflects the law as of its publication date and does not constitute legal or tax advice; applying it to a specific situation requires a qualified legal or tax professional.