
US homeownership rate by age of householder, 1982 to 2025
US homeownership rate by age of the householder
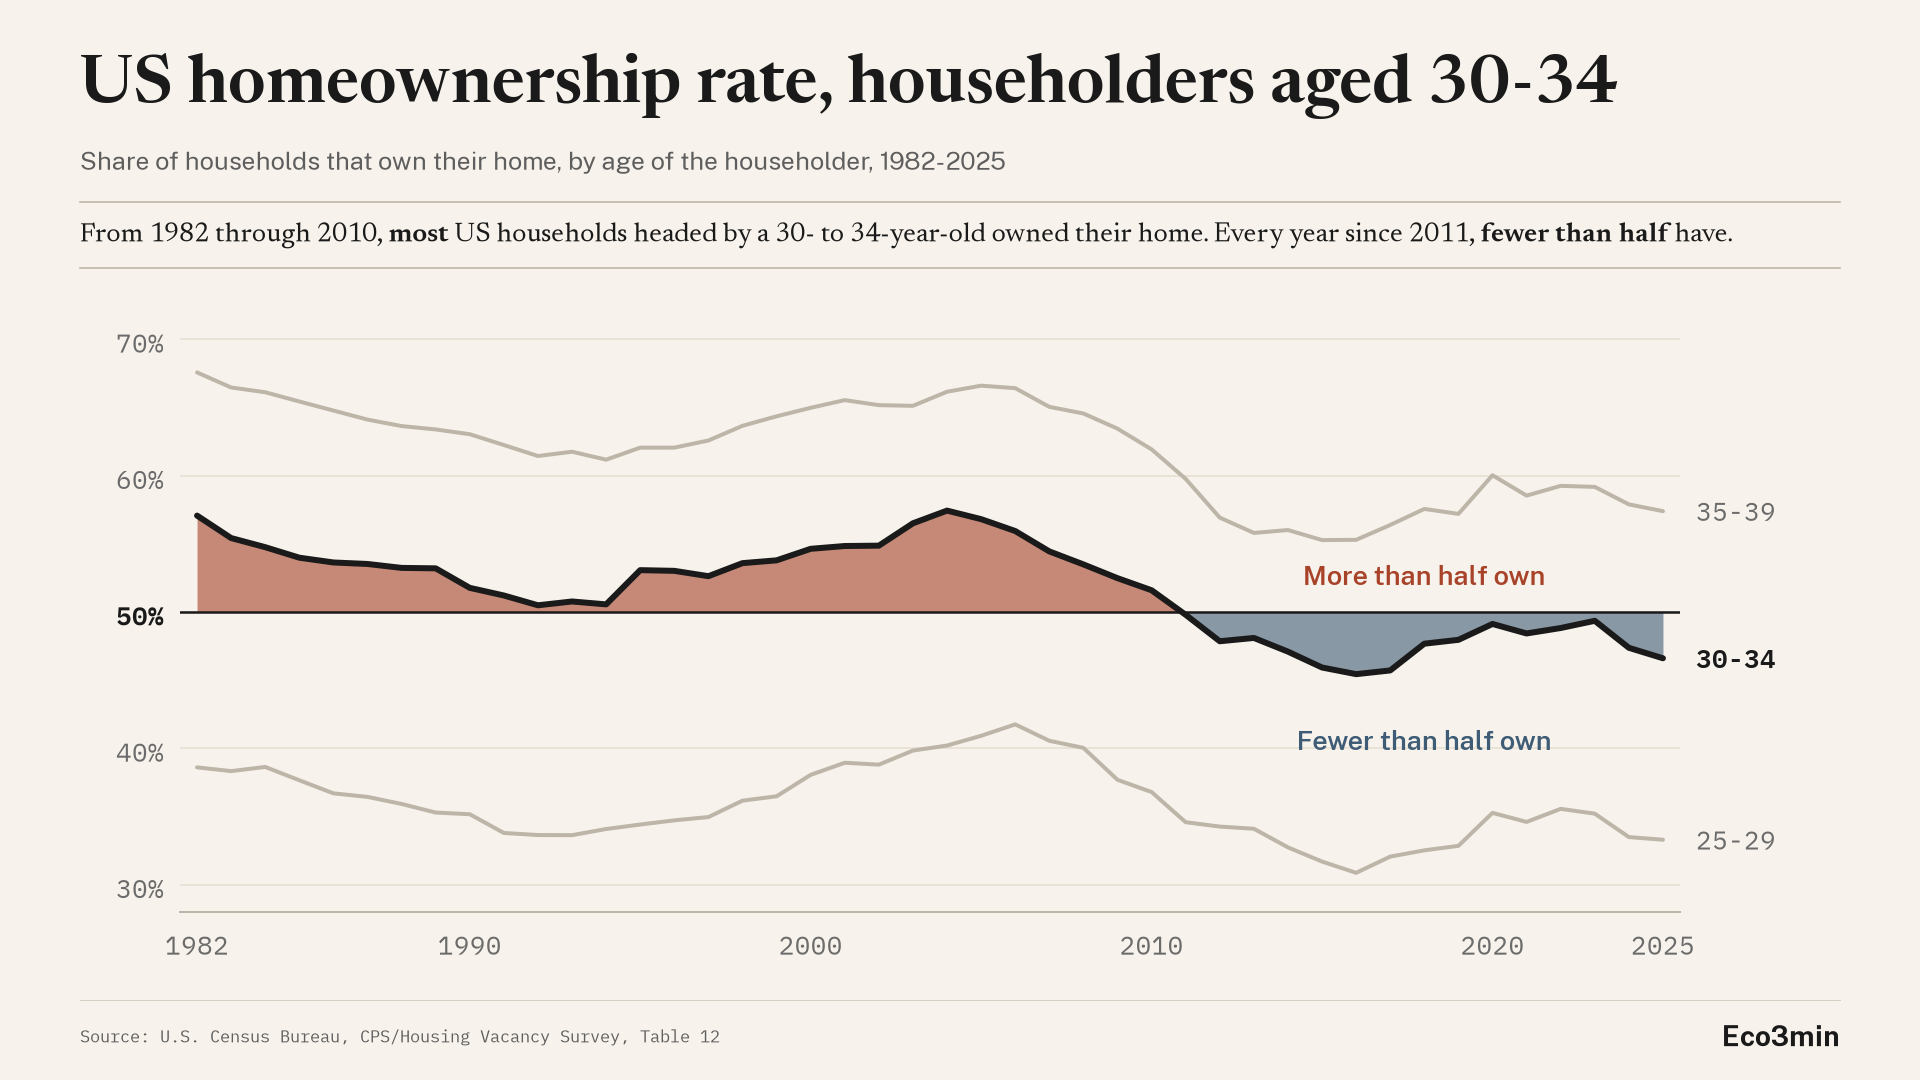
Share of households that own their home, United States, annual, 1982-2025.
Households headed by a 30- to 34-year-old. Tile where most of them owned their home (every year from 1982 through 2010), slate where fewer than half did (every year since 2011). Ages 25-29 and 35-39 in grey: neither ever crosses the 50% line.
Download the data (CSV, 1982-2025)
TL;DR. Since 2011, fewer than half of US households headed by someone aged 30 to 34 have owned their home, every year; from 1982 through 2010, more than half did.
- Householders aged 30 to 34: 57.1% owned in 1982, 46.6% in 2025. Aged 25 to 29: 38.6% and 33.3%. Aged 35 to 39: 67.6% and 57.4%.
- The national rate was 64.8% in 1982 and 65.2% in 2025. Held at the 1982 age mix of households, the 2025 rate would be 60.9%.
- Every five-year age group from 25 to 64 owned less often in 2025 than in 1982; under 25 and the three groups from 65 up owned more often.
The US homeownership rate by age of householder ran from 24.2% for households headed by someone under 25 to 80.6% for those aged 70 to 74 in 2025, calculated from household counts of the U.S. Census Bureau’s Current Population Survey/Housing Vacancy Survey (CPS/HVS). The national rate was 65.2%. The rate rises with each age group up to 70 to 74 and dips to 77.4% at 75 and over. For households headed by someone aged 30 to 34, it was 46.6%, under half, as it has been every year since 2011.
| Age of householder | 1982 | 2025 | Change (points) |
|---|---|---|---|
| Under 25 | 19.3 | 24.2 | +4.9 |
| 25 to 29 | 38.6 | 33.3 | -5.3 |
| 30 to 34 | 57.1 | 46.6 | -10.5 |
| 35 to 39 | 67.6 | 57.4 | -10.2 |
| 40 to 44 | 73.0 | 64.4 | -8.6 |
| 45 to 49 | 76.0 | 68.5 | -7.5 |
| 50 to 54 | 78.8 | 71.2 | -7.6 |
| 55 to 59 | 80.0 | 75.1 | -4.9 |
| 60 to 64 | 80.1 | 76.6 | -3.5 |
| 65 to 69 | 77.9 | 78.5 | +0.6 |
| 70 to 74 | 75.2 | 80.6 | +5.4 |
| 75 and over | 71.0 | 77.4 | +6.4 |
| All households | 64.8 | 65.2 | +0.4 |
Homeownership rate by age of householder, United States, 1982 and 2025, percent of households. All households: 64.8% as published, which includes households with no reported age; 65.0% for households with a reported age. Source: U.S. Census Bureau, CPS/HVS, Table 12. Eco3min calculation from the household counts; changes computed from the rounded rates.
The chart above has three views. The first draws the 30 to 34 line against the 50% line, with the 25 to 29 and 35 to 39 groups for context and each year’s value on hover. The second puts every age group on one chart. The third sets 1982 against 2025 for each of the 12 groups. The data behind them, one row per year, can be downloaded from the CSV link under the chart.
Key figures at a glance
Scope: homeownership rate (owner households divided by all households) by age of householder, United States, annual, 1982 to 2025, 12 five-year age groups from under 25 to 75 and over
Aged 30 to 34: 57.1% (1982), peak 57.4% (2004), lowest of 1982-2010 50.5% (1992), 49.8% (2011), low 45.4% (2016), 46.6% (2025)
National rate: 64.8% (1982, as published), peak 69.0% (2004), low 63.4% (2016), 65.2% (2025); 60.9% in 2025 at the 1982 age mix
Households 65 and older: 21% of all households in 1982, 29% in 2025; their rate 74.4% and 78.6%
Households: 83.7 million (1982), 132.8 million (2025)
Source: U.S. Census Bureau, Current Population Survey/Housing Vacancy Survey, Table 12, household estimates by age of householder, release of March 24, 2026, fetched November 3, 2026. Eco3min calculation of the rates from the household counts.
What the Census counts
The homeownership rate is the share of households that own the home they live in: owner households divided by all households. The Census Bureau estimates it from the Current Population Survey/Housing Vacancy Survey, every quarter and every year. Its Table 12 gives the annual number of households, and of owner households, for the United States by age of householder since 1982, in 12 groups: under 25, then five-year groups up to 74, then 75 and over.
The age is the householder’s: the person, or one of the persons, in whose name the home is owned or rented (Census HVS definitions). The rate counts households, not people. A 32-year-old who lives with their parents, or rents a room in someone else’s home, is not a householder and does not appear in the 30 to 34 group at all, either as an owner or as a renter.
Two notes on the years. From 1982 to 1988, the Census total includes households whose age was not reported, 645 thousand in 1982; from 1989, they are spread across the age groups. The 1982 national rate is 64.8% as published and 65.0% for households with a reported age; the CSV keeps both. The 2025 estimates rest on 11 months: no CPS/HVS data were collected in October 2025, during a lapse in federal funding.
Households aged 30 to 34: above half until 2010, below since 2011
Of the 12 age groups, 30 to 34 is the only one whose rate has been on both sides of 50% since 1982. In 1982, 57.1% of households headed by someone aged 30 to 34 owned their home. The rate stayed above 50% for 29 straight years, through 2010, with a low of 50.5% in 1992 and a high of 57.4% in 2004. In 2011 it was 49.8%, and it has been under 50% in each of the 15 years from 2011 to 2025, with a low of 45.4% in 2016 and 46.6% in 2025. The years closest to the line since then were 2011 (49.8%), 2023 (49.4%) and 2020 (49.1%).
The two neighbouring groups stay on one side of the line. Households aged 25 to 29 owned at 38.6% in 1982 and 33.3% in 2025, never above 41.8% (2006). Those aged 35 to 39 went from 67.6% to 57.4% and never fell under 55% (lowest 55.3% in 2015).
A flat national rate over a changing age mix
Over the same years, the national rate barely moved: 64.8% in 1982, 65.2% in 2025. It peaked at 69.0% in 2004 and was lowest at 63.4% in 2016. The age groups moved more. Every five-year group from 25 to 64 owned less often in 2025 than in 1982, and the four broad Census groups under 65 all fell: under 35 from 41.2% to 37.0%, 35 to 44 from 70.0% to 60.8%, 45 to 54 from 77.4% to 69.8%, 55 to 64 from 80.0% to 75.9%.
The difference is the mix: households moved toward the older age groups, which own more often. Households headed by someone 65 or older went from 21% of all households in 1982 to 29% in 2025, and owned more often, 78.6% against 74.4%; households headed by someone under 35 went from 30% to 20%. Holding the 1982 share of each of the 12 age groups and applying each year’s rates, the 2025 rate comes out at 60.9%, an Eco3min calculation. The gap between the actual and the age-standardized rate has widened to more than 4 points. The rising share of households 65 and older accounts for less than half of it; the rest comes from the shift among younger households, fewer under 35 and more aged 45 to 64. The result holds with the five broad age groups (61.1%) and with the 1994 age mix as the base (62.0%).
The age-standardized rate follows the same arc as the actual one: it peaked in 2004 (67.1%) and was lowest in 2016 (59.7%). In 2025, it stood above that 2016 low.
Under 25: fewer households, more of them owners
The youngest group is the exception below 65. Households headed by someone under 25 owned at 19.3% in 1982 and 24.2% in 2025. They are also a smaller slice of all households, 7.1% in 1982 and 4.4% in 2025, and fewer in number: 5.9 million against 5.8 million.
One possible reading, which the table cannot test: with fewer people under 25 heading a household of their own, those who do may be a group more likely to own. The survey does not follow the same people over time, so it cannot say who stopped forming a household or why.
What the series leaves out
Sampling error. Table 12 prints no margin of error for its annual age groups. For scale, the Census release of October 28, 2026 puts the 90% margin of error at ±0.5 point on the quarterly national rate (Table 4) and ±0.7 point on the quarterly rate for households under 35 (Table 6). A single year near 50%, such as 49.8% in 2011 or 49.4% in 2023, cannot be told apart from the line on its own; what the series shows is the run of years on each side.
2020. The Census Bureau notes that suspending in-person interviews in 2020 may have pushed the homeownership estimate up, as renters were harder to reach (source and accuracy statement). The 30 to 34 rate was 49.1% that year.
Revisions. Table 12 gives 1993 and 2002 twice, before and after reweighting to the 1990 and 2000 censuses. The CSV keeps the revised figures and notes the others; the 1993 national rate moves from 64.5% to 64.0%.
Causes. The survey records who owns, not why. Prices, mortgage rates, incomes, later marriage and household formation are all put forward, and this series cannot separate them. Some of these are followed on other pages: the real US home price index dataset, how mortgage rates set borrowing capacity, whether rates or prices drove US housing affordability, household income percentiles by age of householder, and the real estate and credit cycles hub.
Two ways to read the same lines
One reading: about the same share of households still buys, only a few years later than in 1982. The 30 to 34 group crossed 50% in 2011, while the 35 to 39 group has stayed above 55% throughout.
The other reading: each age group tops out lower. Households aged 35 to 39 went from 67.6% to 57.4%, those aged 40 to 44 from 73.0% to 64.4%, and every five-year group up to 64 was lower in 2025 than in 1982. The 35 to 39 and 40 to 44 lines are where the two readings part. The yearly table does not follow the same households over time, so it does not settle which one holds.
Methodology and sources
Series. U.S. Census Bureau, Current Population Survey/Housing Vacancy Survey, Table 12, annual household estimates for the United States by age of householder, 1982 to 2025, release of March 24, 2026, fetched on November 3, 2026.
Construction. Rate = owner households / all households, for each of the 12 age groups and for the five broad groups, computed from the household counts of Table 12. National rate: as published (Census total row) and for households with a reported age; the two differ from 1982 to 1988 only.
Age-standardized rate. For each year, the sum over the 12 age groups of the group’s 1982 share of households times its rate that year: the rate the United States would have with its 1982 age structure. Robustness: the same with the five broad groups, and with 1994 weights.
Breaks. 1993 and 2002: revised figures (reweighting to the 1990 and 2000 censuses). 2025: 11 months of data. A 2026 row in the CSV holds the mean of the first three quarters of 2026 from the quarterly Table 19, five broad groups only.
Limitations. Households, not people. No margin of error in Table 12. National figures only. The series records ownership, not its causes.
Reproducibility. The CSV below is built by script from the Census spreadsheets; no value is typed in. The chart is produced with Python (matplotlib), the interactive version in plain SVG.
Common misinterpretations
Reading it as the share of people aged 30 to 34 who own. The rate counts households by the age of the householder. Adults living in a home headed by someone else are in neither the numerator nor the denominator of their own age group.
Reading a flat national rate as no change. The national rate was close in 1982 and 2025, but the age mix moved: at the 1982 mix, 2025 comes out at 60.9%.
Reading one year near 50% as the crossing. Table 12 prints no margin of error for the age groups, so a year close to the line, such as 2011 or 2023, cannot be told apart from 50% on its own. The crossing is the run: 29 years above, then 15 below.
Frequently asked questions
What is the homeownership rate by age in the US?
In 2025, 24.2% for households headed by someone under 25, 33.3% at 25 to 29, 46.6% at 30 to 34, 57.4% at 35 to 39, rising to 80.6% at 70 to 74 and 77.4% at 75 and over, calculated from Census CPS/HVS Table 12 household counts. The national rate was 65.2%.
46.6% in 2025. The rate has been under 50% every year since 2011, after 29 years above it; it was 57.1% in 1982.
Is the US homeownership rate going up?
The annual national rate was 65.2% in 2025, above its 2016 low of 63.4% and below its 2004 peak of 69.0%. The latest quarterly estimate is 65.5% for the third quarter of 2026 (Census release of October 28, 2026).
What is the age-adjusted homeownership rate?
Held at the 1982 age mix of households, the 2025 US rate would be 60.9%, against 65.2% measured. This is an Eco3min calculation from Table 12, not a Census statistic.
Does the Census publish a homeownership rate for millennials?
No. Table 12 groups households by the age of the householder in a given year, not by birth year. In 2025, households aged 25 to 29, 30 to 34 and 35 to 39 owned at 33.3%, 46.6% and 57.4%.
Why does 2025 rest on 11 months?
The Census Bureau collected no CPS/HVS data in October 2025, during a lapse in federal funding. The annual 2025 estimates are based on the remaining 11 months.
Download the complete dataset
One CSV file: one row per year from 1982 to 2025, plus a 2026 row with the mean of its first three quarters. For each year, the rate of each of the 12 age groups and of the five broad groups, households by age group, the national rate as published and for households with a reported age, and the age-standardized rates.
Source: U.S. Census Bureau, Current Population Survey/Housing Vacancy Survey.
Conclusion
From 1982 through 2010, more than half of US households headed by someone aged 30 to 34 owned their home; every year from 2011 to 2025, fewer than half did. Over the 43 years from 1982 to 2025, the national rate went from 64.8% to 65.2% while every five-year group from 25 to 64 fell, and the shift of households toward older age groups made up the difference.
The annual 2026 estimates are due with the Census Bureau’s fourth-quarter 2026 release, which was not yet on its release calendar as of November 3, 2026.
Last updated — 3 November 2026
Disclaimer – Financial and Legal Information: The analyses, commentary, and content published on eco3min.fr are provided for informational and educational purposes only. They do not constitute investment advice or a solicitation to buy or sell financial instruments. Past performance is not indicative of future results. All investment decisions involve risk and are the sole responsibility of the reader. Data, charts and calculated series are provided as is and may contain errors or lag behind their source: check any figure against the primary source cited before relying on it. Content describing laws, regulations or contracts reflects the law as of its publication date and does not constitute legal or tax advice; applying it to a specific situation requires a qualified legal or tax professional.