
Anatomy of the 2022 Gas Shock: From the Russian Cutoff to Rationing

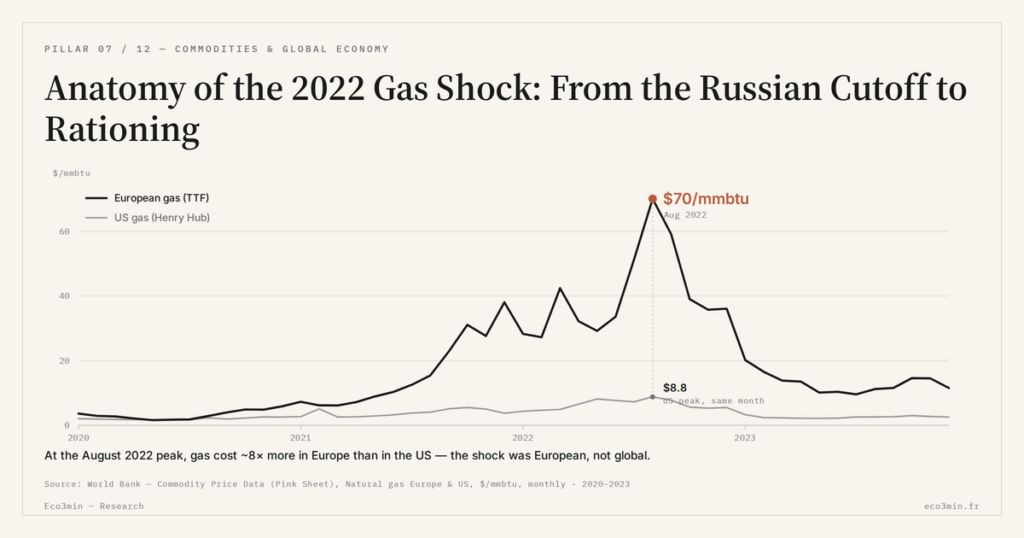
The 2022 gas crisis played out in a few months along a precise sequence: rupture of Russian flows, price surge, a scramble to fill storage amplified by seasonality, then adjustment through industrial rationing.
TL;DR
Unable to expand supply quickly, the 2022 gas market rebalanced by destroying industrial demand, and for the hardest-hit sectors that pause hardened into a lasting competitiveness gap.
- Russian pipeline gas, around 40% of EU demand before 2022 on European Commission estimates, was cut back from spring 2022 with no replacement at the scale required.
- The surge reflected inelasticity rather than the volume lost: the EU Council records the TTF above €300/MWh in August 2022, with five sessions over €265/MWh between 22 and 26 August, against a €5 to €35 prior-decade average.
- Demand destruction rather than extra supply capped prices: ammonia, base chemicals and heat-based metallurgy cut output, and some shifted toward cheaper-energy regions instead of restarting.
Rather than treating it as one undifferentiated event, this piece breaks the mechanism down link by link, from the supply shock to the demand response.
The starting point: the rupture of Russian flows
It begins with supply. Before 2022, Russian pipeline gas covered, on European Commission estimates, on the order of 40% of the Union’s demand. It was the continent’s largest, most stable and cheapest source. From spring 2022, these flows were cut back and then largely halted. In a few months, Europe lost the backbone of its gas supply, with no immediate replacement at the required scale.
The physical nature of gas immediately turns that supply shock into market strain. Pipeline supply cannot be replaced in a few weeks: liquefied natural gas import terminals are not built in a quarter, available carriers are limited in number, and European production is marginal. Europe thus faced a deficit that no rapid supply adjustment could close. This rigidity is the soil for everything that follows; it is inseparable from the rupture of Russian flows and its geopolitical drivers.
The meaning of such dependence is worth measuring. For decades, Europe’s gas architecture had been built around Russian imports: pipeline routes, long-term contracts, infrastructure sizing. Undoing that edifice and redirecting it toward other sources — Norway, US and Qatari LNG — was possible, but slowly, at the cost of a period of extreme strain. The 2022 shock is first of all the brutal revelation of that structural inertia. On how imported energy fed through to the euro, see our analysis of imported energy and the euro.
The price surge: TTF at record highs
Deprived of its main source, the market tipped into a scarcity logic, and the European benchmark price soared. According to the Council of the EU, the TTF price exceeded €300/MWh in August 2022 — an all-time record — with five consecutive sessions above €265/MWh between 22 and 26 August; ICE Endex data place the intraday peak around €342/MWh on 26 August. For scale, the Council recalls that the previous decade’s average ranged between €5 and €35/MWh. The price thus climbed, at its peak, to nearly ten times its historical norm. TTF’s 2022 records remain, to this day, without equivalent in the market’s history.
The contrast with the other side of the Atlantic underscores the regional character of the shock. At the same moment, US Henry Hub saw far milder strain — a peak around $8.80/MMBtu in August 2022, on Energy Information Administration data — nothing like the European explosion. The calm of US Henry Hub against the TTF surge illustrates a truth of the gas market: a supply shock strikes one region and not the others, because prices do not equalize. The 2022 crisis was a European crisis, not a global one.
This surge did not mechanically track the volume of gas lost. It far exceeded it, because gas demand is, in the short run, very inelastic: households and industry cannot instantly cut consumption. When supply contracts against rigid demand, the price must rise sharply to restore balance, up to the point where consumption finally gives way. The price did not merely reflect scarcity; it was the instrument through which the market forced the adjustment.
Beyond the level, it was volatility that marked the episode. Prices did not climb steadily: they jumped and receded with announcements on Russian flows, weather forecasts and storage levels. This instability made planning difficult for industrial buyers, unable to fix a stable input cost. The crisis therefore meant not only expensive gas, but unpredictable gas — a double constraint for anyone who had to commit purchases or keep production running.
The scramble for storage and the role of seasonality
One factor amplified the strain: the need to build reserves before winter. Gas is stored underground over summer to be drawn down in the cold season, when heating demand peaks. In 2022, Europe had to fill its storage while having lost its main supply source — an equation that turned summer, usually a period of easing, into the moment of maximum strain.
This race to refill had a direct consequence on the world market. To rebuild its reserves, Europe massively captured available LNG cargoes, outbidding Asia for every carrier. European demand, forced to fill at whatever price, was rarely inelastic: it had to buy, full stop. That pressure pulled prices higher and redrew global LNG flows toward Europe, to the detriment of Asian buyers.
Seasonality, usually absorbed by stocks, thus became an acute source of strain. In a system with margins, a cold spell is handled by drawing on reserves. In 2022, those margins were thin: each cold wave bore directly on an already fragile balance, each weather revision moved prices. Storage, ordinarily a silent buffer, became a watched variable and a point of vulnerability. It is this seasonal dimension that gave the shock its jagged rhythm, hanging on fill levels and winter forecasts.
The demand-side adjustment: industrial rationing
At the end of the chain, since supply could not expand quickly, it was demand that had to bend. The adjustment took the form of reduced consumption, concentrated first on the uses most exposed to the gas price. The most energy-intensive industries — ammonia and fertilizer production, base chemicals, heat-based metallurgy — cut or halted part of their output, unable to absorb an energy bill multiplied severalfold.
This rationing was not, for the most part, imposed by decree: it resulted from the price itself. When the cost of gas exceeds the break-even point of a given output, shutdown becomes the economic response. This demand destruction played a paradoxical stabilizing role: by withdrawing consumption, it helped cap prices as much as the extra LNG imports did. The market found its balance not through additional supply, but through an amputation of demand — a costly adjustment, borne first of all by industry.
It is here that the real price of the shock is measured, beyond the quotations. Halted output means lost activity, disrupted value chains, sometimes lasting closures. The detail of those sectoral consequences lies beyond this narrative; it belongs to the analysis of the sectors concerned. But the anatomy of the shock would be incomplete without this last link: rationing is not a side effect, it is the very mechanism by which a regional gas system, deprived of a relief valve, returned to balance.
The adjustment also carried a competitive dimension. Producers facing energy costs several times those of their US or Asian rivals lost ground on world markets, and some output did not simply pause but shifted toward regions with cheaper energy. The fuller picture of which sectors were affected belongs elsewhere; what matters for the anatomy is that rationing was not only a domestic balancing act but the start of a competitiveness gap that outlasted the price spike. A shutdown framed as temporary can become permanent when the cost gap that caused it does not close — and that is precisely what part of European industry confronted after 2022.
It is often assumed the gas price simply tracked the volume lost, as if a 40% cut should produce a proportional rise. The reality is different: because demand is very inelastic in the short run, the price had to rise well beyond the physical deficit to force the adjustment. The shock was measured in multiples, not in percentages of volume — it was inelasticity, as much as the cut, that made the scale of the surge.
What the shock set in motion
The anatomy of 2022 does not end with the restoration of balance. The shock triggered dynamics that extended it well beyond the year. The first is macroeconomic: the gas surge spread to electricity prices, then to the whole economy, initiating the pass-through to inflation that redefined the European monetary framework. The second is structural: by durably replacing Russian gas with world-priced LNG, Europe saw settle in what the shock had revealed — the end of cheap energy in Europe as an acquired advantage.
Set in a longer perspective, the episode joins the family of major energy shocks. Like historical oil shocks, it combines a geopolitical trigger, supply that is rigid in the short run, and a deep transmission to the real economy. The difference lies in the regional nature of gas: where an oil shock strikes a world market, the 2022 gas shock struck one zone, because gas prices are not shared across continents. Understanding this specificity belongs to energy market analysis in its structural dimension.
The anatomy of the shock thus yields a lesson that goes beyond 2022: a system’s vulnerability lies not only in the size of a disturbance, but in its capacity to absorb it. Europe took the cut hard because it had neither the supply flexibility, nor the storage margins, nor the supply diversity needed to cushion the shock. Rebuilding those capacities was the response of the following years — without, for all that, closing the price fracture the shock had brought to light.
Last updated — 10 July 2026
Disclaimer – Financial Information: The analyses, commentary, and content published on eco3min.fr are provided for informational and educational purposes only. They do not constitute investment advice or a solicitation to buy or sell financial instruments. Past performance is not indicative of future results. All investment decisions involve risk and are the sole responsibility of the reader.
Read next
Full pillar →Reading the refinery utilisation rate: the threshold, the season, the turnarounds
A refinery runs full near ninety percent, not a hundred: the last slice of nameplate capacity is a…
IMO 2020: the regulatory shock that rewrote product spreads
An environmental rule on marine sulfur can move a refining spread more than a swing in crude. IMO…
The 2022–2023 refining golden age: anatomy of an episode
In 2022, refined fuel prices climbed faster than crude. That gap, measured by the 3-2-1 crack spread, reached…


