
Developed vs emerging markets: the risk-return profile
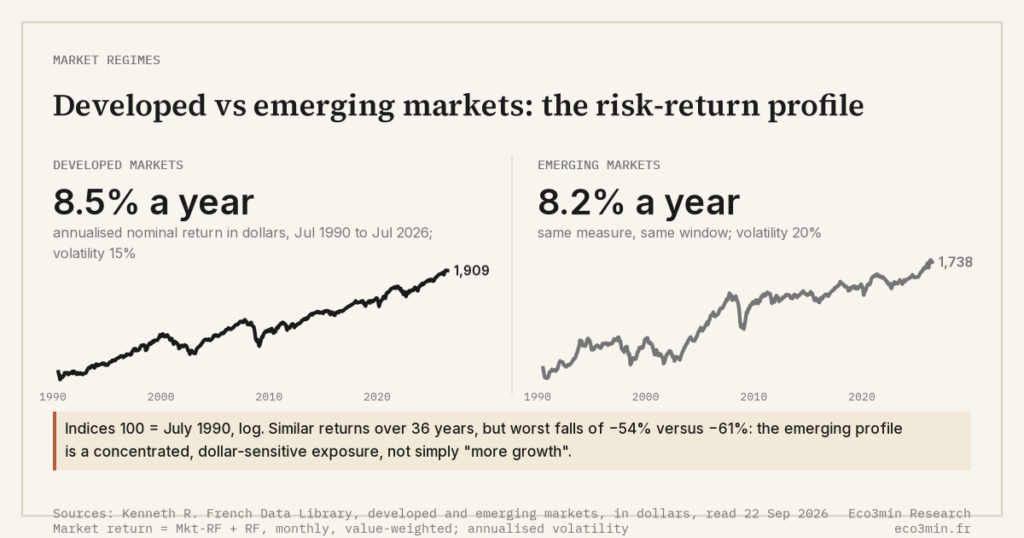
Developed markets (the economies in MSCI World) have deep, liquid capital markets and convertible currencies; emerging markets (the economies in MSCI EM) grow faster but carry thinner markets and external-financing risk. The decisive difference is not growth versus maturity: the MSCI EM index is a concentrated, dollar-sensitive exposure to a few Asian economies, with Taiwan, China and South Korea making up roughly two-thirds of its weight (MSCI, 30 April 2026).
In this comparison
Why this comparison matters
The choice is usually framed as a tradeoff: higher growth in emerging markets, lower risk in developed ones. The data complicate that picture. Over the past decade developed equities delivered both higher returns and a higher Sharpe ratio; over the prior decade the order reversed. The persistent confusion is treating “emerging markets” as a diversified engine of developing-world growth, when the index is dominated by a handful of large Asian economies whose returns track the dollar and the global technology cycle far more than headline GDP. Getting the distinction right means understanding what actually drives each: earnings breadth and currency stability on one side, capital flows and dollar liquidity on the other.
What developed markets are
Developed markets are the high-income economies in the MSCI World index (the United States, Japan, the United Kingdom, the euro area and others) defined by deep, liquid capital markets, freely convertible currencies and stable institutions. The index spreads its weight across a large number of constituents and trades at a higher valuation than the emerging-market index, with a lower dividend yield (MSCI, 30 April 2026). Convertible currencies and reliable settlement reduce the external-financing risk that recurs in developing economies. The United States dominates its market capitalization, so in practice the label describes a large-cap, US-and-technology-weighted exposure rather than a neutral basket of rich countries.
→ Framework: Equity markets, ETFs, structure, valuations and cycles
What emerging markets are
Emerging markets are the developing economies in the MSCI EM index (led by Taiwan, China, South Korea and India) with faster nominal growth but thinner markets, less currency convertibility and greater dependence on external financing. The index holds a comparable number of constituents but trades at a lower valuation, with a higher dividend yield (MSCI, 30 April 2026). The category is defined less by size than by sensitivity: capital flows in when global dollar funding is cheap and out when it tightens, which makes the dollar cycle the dominant variable behind the asset class.
→ In-depth explanation: Why are emerging markets more vulnerable to dollar cycles?
The key differences
Return and risk-adjusted return. Over the 10 years to April 2026, MSCI World delivered a clearly higher annualized net return than MSCI Emerging Markets (MSCI). Developed equities also carried lower volatility and a markedly higher Sharpe ratio. Over the longer window since end-2000 the order inverts: EM compounded faster than developed markets, with most of that lead earned in the weak-dollar, commodity-driven years of 2003 to 2010.
Drawdowns and tail risk. The deeper difference is in the downside. Since 2000 the MSCI EM index has suffered a deeper maximum drawdown than the developed-market index (MSCI). Faster growth has historically come bundled with larger losses, not smoother compounding.
Composition. The decisive distinction is breadth, not maturity. Developed markets spread risk across a large number of names and several large economies; the EM index is concentrated. Taiwan, China and South Korea together make up roughly two-thirds of its weight (MSCI, 30 April 2026); information technology is its dominant sector, and Taiwan Semiconductor alone weighs more than most member countries. Contrary to the idea that emerging markets are a diversified play on the developing world, the MSCI EM index is a concentrated exposure to the Asian technology complex and the dollar cycle.
Valuation. As of 30 April 2026, EM traded at a much lower forward price-to-earnings ratio and price-to-book ratio than developed markets (MSCI). This describes a valuation gap; it is not a value judgment.
How they behave across regimes
Emerging-versus-developed relative performance has historically tracked the dollar cycle. In weak-dollar, high-liquidity phases with rising commodities (2003 to 2007, and again in 2009 and 2010) emerging markets led, as cheaper dollar funding and stronger external balances supported capital inflows. Through the strong-dollar decade that followed, roughly 2011 to 2021, developed markets and US large-cap technology in particular dominated, while a rising dollar tightened EM financial conditions and triggered outflows. In 2022 the synchronized rate shock pulled both down, by similar magnitudes, EM slightly more (MSCI net returns). The switching parameter is the dollar and US real rates: cheap, soft-dollar conditions have tended to favour EM, a strengthening dollar the reverse. In 2025, with EM clearly ahead of developed markets (MSCI net returns), the pattern of EM leadership re-emerged.
Emerging markets are less a diversified play on the developing world than a concentrated exposure to the dollar cycle and the Asian technology complex.
→ Framework: Macro-financial regimes
The common confusion
The frequent error is to treat “emerging markets” as a broadly diversified growth allocation: many small, fast-growing economies offsetting one another. The index reality is close to the opposite: roughly two-thirds of its weight sits in three Asian economies, and a single sector dominates it. A related confusion assumes faster GDP growth must translate into higher equity returns. Over the past decade developed markets compounded faster despite slower output growth, because index returns are driven by earnings, currency stability and changes in valuation, not by headline GDP. The reliably broad, small-economy exposure that “emerging” suggests is closer to what frontier markets, one rung below, actually offer. A companion piece: Our full table of comparisons.
Practical observation
What the data suggests for framing your own analysis:
- Question to ask yourself: is a position labelled “emerging markets” a diversified developing-world exposure, or a concentrated exposure to Asian technology and the dollar cycle?
- Data to monitor: the US dollar index (DXY) and US real rates, historically the dominant switch between emerging- and developed-market leadership.
- Historical parallel: developed markets outpaced EM across the strong-dollar 2011–2021 decade; the reverse held in the weak-dollar 2003–2007 window (MSCI net returns).
- What the literature documents: MSCI factsheet data (30 April 2026) show EM with higher volatility over 10 years and lower risk-adjusted returns than developed markets over the past decade.
This is descriptive information to help you frame your own analysis. Eco3min does not provide investment advice.
Go deeper
💸 Capital flows: Capital flows and price formation in markets
💰 Currencies and the dollar: FX markets, exchange rates and monetary regimes
Related guides
Frequently asked questions
How do developed and emerging markets differ in risk and return?
Over the 10 years to April 2026, MSCI World delivered a clearly higher annualized net return than MSCI Emerging Markets, with lower volatility and a higher Sharpe ratio, according to MSCI factsheet data. The relationship is not fixed: since end-2000 EM has led, compounding faster than developed markets. The pattern depends heavily on the dollar cycle rather than on growth differentials alone, which is why the two can swap leadership for years at a time.
Why is the MSCI Emerging Markets index so concentrated?
Because a few large Asian economies and one sector dominate it. As of 30 April 2026, Taiwan, China and South Korea together accounted for about two-thirds of the index (MSCI); information technology is its dominant sector, and Taiwan Semiconductor alone weighs more than most entire member countries. This is why the “emerging markets” label can mislead: the exposure tracks the Asian semiconductor cycle and dollar liquidity more than broad developing-world growth, and it differs sharply from the smaller, less liquid frontier markets that sit one rung below.
When have emerging markets outperformed developed markets?
Historically, EM leadership has coincided with a weak dollar. Emerging markets led during the commodity-and-weak-dollar years of 2003 to 2007 and again in 2009 and 2010, then lagged through the strong-dollar decade of roughly 2011 to 2021, when US large-cap technology dominated. In 2025 the pattern re-emerged, with EM clearly ahead of developed markets (MSCI net returns). The dollar and US real rates have been the dominant switch, which is why EM is often described as a dollar-cycle exposure. Far from stopping at emerging markets, the same switch is what makes a strong dollar redefine the hierarchy of financial performance asset class by asset class.
Last updated — 22 September 2026
Disclaimer – Financial and Legal Information: The analyses, commentary, and content published on eco3min.fr are provided for informational and educational purposes only. They do not constitute investment advice or a solicitation to buy or sell financial instruments. Past performance is not indicative of future results. All investment decisions involve risk and are the sole responsibility of the reader.
Data, charts and calculated series are provided as is and may contain errors or lag behind their source: check any figure against the primary source cited before relying on it.
Content describing laws, regulations or contracts reflects the law as of its publication date and does not constitute legal or tax advice; applying it to a specific situation requires a qualified legal or tax professional.
Read next
Full pillar →Bitcoin ETF vs self-custody: structure compared
A spot Bitcoin ETF and self-custody give exposure to the same underlying asset, so they do not differ…
DeFi vs traditional finance: rails compared
DeFi runs lending, trading and leverage through smart contracts on public blockchains; traditional finance runs the same functions…
QE vs rate cuts: two different easing tools
Quantitative easing and rate cuts are both forms of monetary easing, but they act on different prices through…