
How Many Refineries in the US Are Operating?
How many refineries in the US are operating? On January 1, 2026, the EIA counted 128 running out of 130 operable sites in 30 states, with half the national capacity in Texas and Louisiana.
Count the sites the EIA calls operable, the sites actually running or the sites with a crude unit, and you get three totals: 130, 128, 124. One California refinery idled in April 2026 is still inside all three.
As of January 1, 2026, the US had 130 operable refineries, 171 fewer than in 1982, with 1.5% more distillation capacity.
- Texas (34), Louisiana (15) and California (12) hold 61 of the 130 sites. Texas and Louisiana alone carry 50.3% of capacity, 9,140,023 of 18,160,493 barrels per calendar day (b/cd).
- Six of the 130 have no atmospheric distillation unit, which is why a file filtered on crude units returns 124.
- Of the net fall of 171, 78 came by 1985, and nine states with a refinery in 1982 have none today.
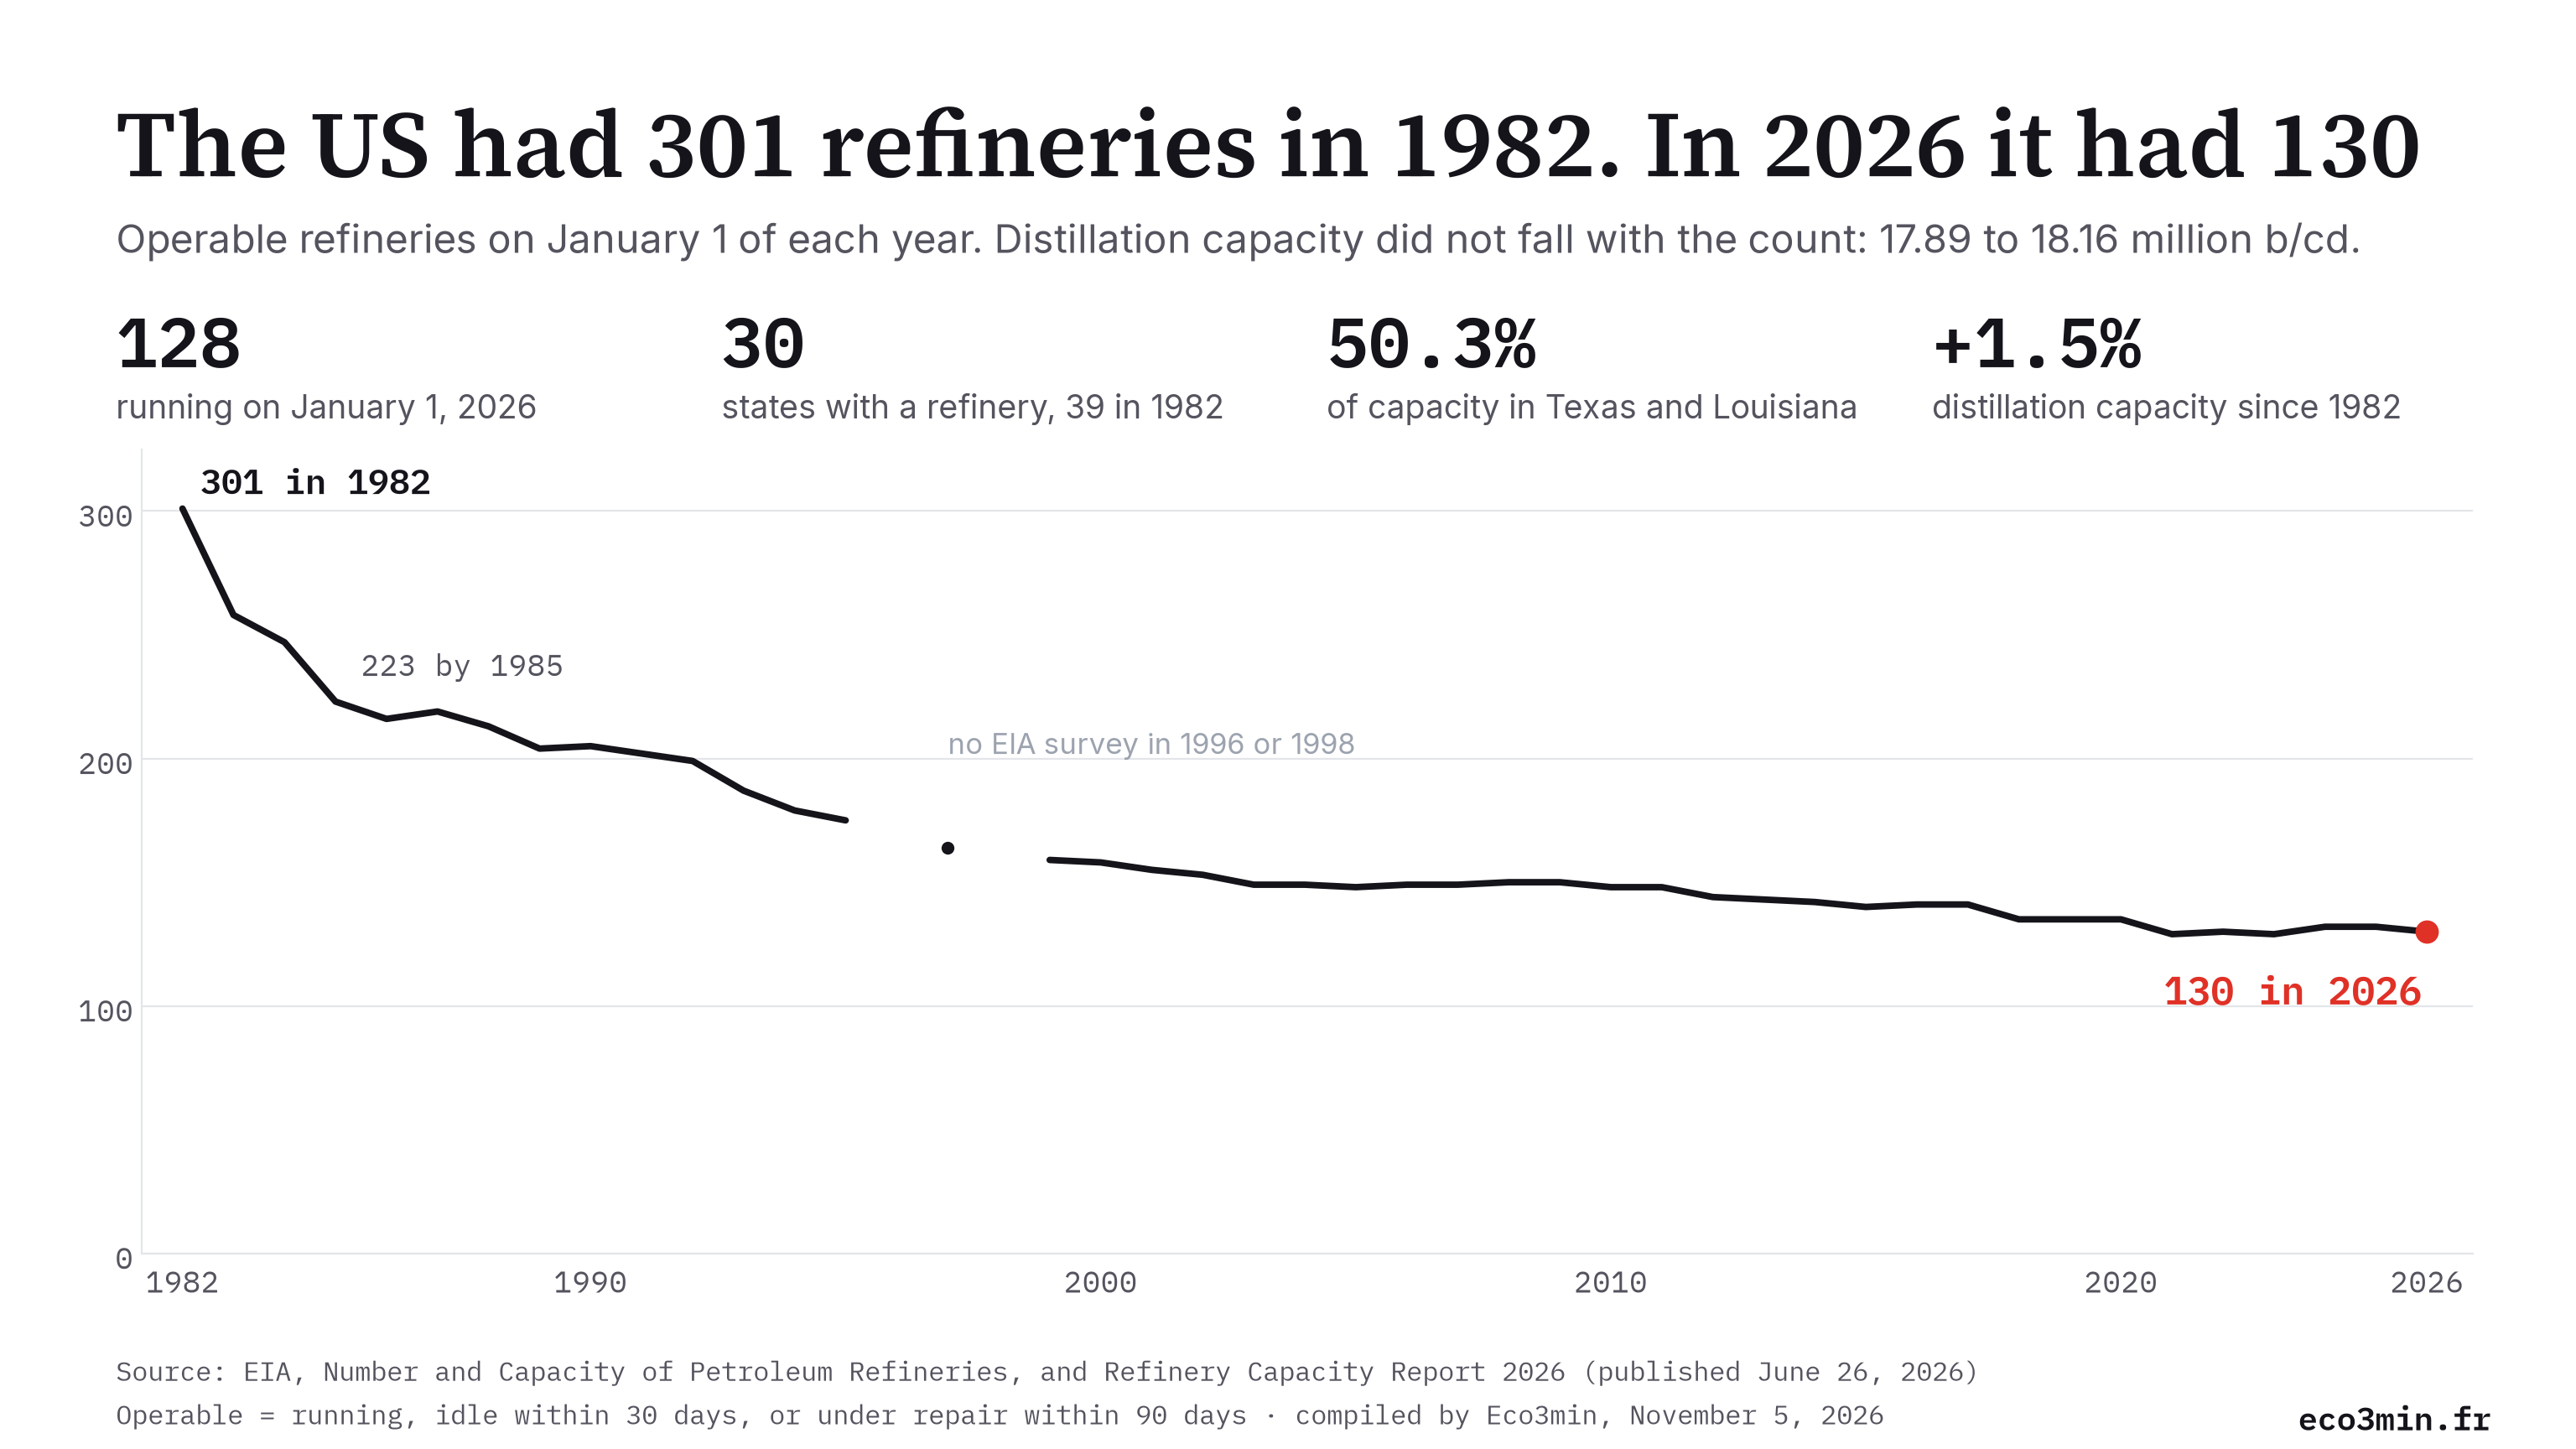
The EIA counts refineries once a year, on January 1, in a national table that starts in 1982. The latest edition of its Refinery Capacity Report, published on June 26, 2026, puts atmospheric crude distillation capacity at 18,160,493 b/cd. No state without a refinery in 1982 has one today.
How many refineries each US state has
States are sorted by the 2026 count, with 1982 alongside. Capacity means atmospheric crude distillation, measured by the EIA in barrels per calendar day, and the last column is each state’s percentage of the national total.
| State | 2026 | 1982 | Change | b/cd | % of US | |
|---|---|---|---|---|---|---|
| United States | 130 | 301 | −171 | 18,160,493 | 100.0% | |
| Texas | 34 | 65 | −31 | 6,134,650 | 33.8% | |
| Louisiana | 15 | 34 | −19 | 3,005,373 | 16.5% | |
| California | 12 | 43 | −31 | 1,499,171 | 8.3% | |
| Washington | 5 | 8 | −3 | 648,200 | 3.6% | |
| Oklahoma | 5 | 13 | −8 | 543,800 | 3.0% | |
| Utah | 5 | 8 | −3 | 213,089 | 1.2% | |
| Alaska | 5 | 4 | +1 | 177,000 | 1.0% | |
| Illinois | 4 | 8 | −4 | 1,053,023 | 5.8% | |
| Ohio | 4 | 6 | −2 | 606,600 | 3.3% | |
| Montana | 4 | 6 | −2 | 210,000 | 1.2% | |
| Wyoming | 4 | 12 | −8 | 127,000 | 0.7% | |
| New Jersey | 3 | 6 | −3 | 467,000 | 2.6% | |
| Kansas | 3 | 11 | −8 | 413,000 | 2.3% | |
| Mississippi | 3 | 7 | −4 | 393,940 | 2.2% | |
| Pennsylvania | 3 | 9 | −6 | 268,000 | 1.5% | |
| Alabama | 3 | 6 | −3 | 142,100 | 0.8% | |
| Indiana | 2 | 7 | −5 | 471,700 | 2.6% | |
| Minnesota | 2 | 2 | 0 | 440,000 | 2.4% | |
| Colorado | 2 | 3 | −1 | 103,000 | 0.6% | |
| Arkansas | 2 | 4 | −2 | 90,500 | 0.5% | |
| Kentucky | 1 | 4 | −3 | 307,000 | 1.7% | |
| Tennessee | 1 | 1 | 0 | 180,000 | 1.0% | |
| Delaware | 1 | 1 | 0 | 171,000 | 0.9% | |
| Michigan | 1 | 5 | −4 | 146,000 | 0.8% | |
| New Mexico | 1 | 7 | −6 | 110,000 | 0.6% | |
| Hawaii | 1 | 1 | 0 | 93,500 | 0.5% | |
| North Dakota | 1 | 3 | −2 | 72,000 | 0.4% | |
| Wisconsin | 1 | 1 | 0 | 49,547 | 0.3% | |
| West Virginia | 1 | 3 | −2 | 22,300 | 0.1% | |
| Nevada | 1 | 1 | 0 | 2,000 | 0.0% |
The nine states that had a refinery in 1982 and have none today, with the last year each was counted: Georgia (2014), Virginia (2011), Oregon (2008), Arizona (1995), New York (1993), Florida (1988), Maryland (1986), Missouri (1982) and Nebraska (1982). North Carolina appears only from 1983 to 1992. Alaska is the only state with more refineries than in 1982, 5, up from 4.
Fewer sites, about the same capacity
The US now has under half the operable sites of 1982 and slightly more capacity. It had 301 on January 1, 1982, with 17,889,734 b/cd of distillation capacity, and 130 on January 1, 2026, with 18,160,493 b/cd: a 56.8% fall in the count and a 1.5% rise in capacity. Averaged over every operable site, capacity went from 59,434 to 139,696 b/cd, 2.35 times the 1982 figure.
The fall came early. The count stood at 223 by 1985, then 175 in 1995, 148 in 2010 and 135 in 2020. The EIA table records that pace and gives no cause for it.
Since 1990 the net fall is 75, from 205 to 130. Eco3min’s register of every permanent US refinery shutdown since 1990 lists 90 entries inside the national total. The 15-site difference reflects sites entering or returning to the count: the EIA’s list of recently built refineries names 7 from 2014 onward.
Site size now runs from 1,700 b/cd at Talley Asphalt Products Inc in Kern, California, to 656,400 b/cd at Motiva Enterprises LLC in Port Arthur, Texas. The median site with a crude unit has 91,250 b/cd. The five largest hold 3,080,900 b/cd, 17.0% of the national total and more than the 65 smallest crude sites combined (3,006,056 b/cd).
A refinery count that falls by 171 sites while capacity rises says little about how much crude the country can refine.
Why the answer is 130, 128 or 124
The EIA’s glossary counts a refinery as operable if, at the start of the year, it was in operation, idle but “capable of being placed into operation within 30 days”, or under active repair that could finish within 90 days. That definition gives 130. Take out the two idle sites, CPI Operations LLC in Paulsboro, New Jersey (32,000 b/cd), and Foreland Refining Corp in Ely, Nevada (2,000 b/cd), and 128 remain in operation.
Filter the EIA’s site file on atmospheric distillation and 124 remain. Six operable sites report no crude unit and run other process units. They close the list below, at ranks 125 to 130. All six appear in Table 3 of the report and in the state counts, so Texas has 34 refineries on the count and 29 with a crude unit, Louisiana 15 and 14.
The same split explains a figure that circulates in search summaries, 254 refineries in 1982. That is the EIA’s operating column for that year, and the operable column says 301. Either comparison holds inside its own column, 301 to 130 or 254 to 128. Setting 254 against 130 mixes the two and understates the fall by 47 sites.
The count is already out of date
The 130 is a January 1 snapshot, and California has moved since. Valero’s Benicia refinery, 145,000 b/cd or 0.8% of national capacity, is counted as operating in the 2026 report. Valero’s quarterly filing for the second quarter of 2026 says “full idling of all processing units was completed in April 2026” and that it plans to “keep the facilities in a safe, clean, and idled condition”.
The EIA’s monthly numbers have already moved. Its note on the 2026 report says the site “has also ceased refining operations” and that its capacity left the monthly estimates as of March 2026. The annual count has not followed: the next report is scheduled for June 25, 2027. The idle category covers a plant that could return within 30 days, or one under active repair finishing within 90. If Benicia lands there, the operable count holds and one fewer site is running. If it is recorded as shut down, the operable count loses one, other things equal.
Last year’s exits are already out of the 130. Table 11 of the report, New, Shutdown and Reactivated Refineries During 2025, lists Houston Refining in Houston (263,776 b/cd, last operated February 2025) and Phillips 66 in Los Angeles (138,700 b/cd, October 2025). Eco3min follows those exits site by site in its account of US refinery closures since the 2020 peak. In the June 2027 edition, the idle column of the national table counts sites kept on standby, and a shutdown line in Table 11 marks a site that left the count.
Map of US refineries by state, 1982 to 2026
Drag the year slider to redraw the map, then select a state for its count over time and its 2026 sites. California went from 43 to 12, Texas from 65 to 34, Louisiana from 34 to 15. The years 1996 and 1998 stay blank because the EIA ran no survey and nothing is interpolated.
The 130 operable US refineries
The full list for January 1, 2026, largest first, with EIA company and site names in standard case. A capacity of 0 marks a site with no crude unit.
| # | Company | Site | State | b/cd | Status |
|---|---|---|---|---|---|
| 1 | Motiva Enterprises LLC | Port Arthur | Texas | 656,400 | operating |
| 2 | Marathon Petroleum Co LP | Galveston Bay | Texas | 631,000 | operating |
| 3 | Marathon Petroleum Co LP | Garyville | Louisiana | 617,000 | operating |
| 4 | ExxonMobil Refining & Supply Co | Beaumont | Texas | 612,000 | operating |
| 5 | ExxonMobil Refining & Supply Co | Baytown | Texas | 564,500 | operating |
| 6 | ExxonMobil Refining & Supply Co | Baton Rouge | Louisiana | 523,500 | operating |
| 7 | CITGO Petroleum Corp | Lake Charles | Louisiana | 471,200 | operating |
| 8 | BP Products North America Inc | Whiting | Indiana | 435,000 | operating |
| 9 | Premcor Refining Group Inc | Port Arthur | Texas | 385,000 | operating |
| 10 | Tesoro Refining & Marketing Co | Carson | California | 365,000 | operating |
| 11 | Chevron USA Inc | Pascagoula | Mississippi | 356,440 | operating |
| 12 | WRB Refining LP | Wood River | Illinois | 345,000 | operating |
| 13 | Flint Hills Resources LP | Saint Paul | Minnesota | 335,000 | operating |
| 14 | Deer Park Refining LP | Deer Park | Texas | 312,500 | operating |
| 15 | Marathon Petroleum Co LP | Catlettsburg | Kentucky | 307,000 | operating |
| 16 | Flint Hills Resources LP | Corpus Christi West | Texas | 290,000 | operating |
| 17 | Valero Refining Co Texas LP | Corpus Christi | Texas | 290,000 | operating |
| 18 | Chevron USA Inc | El Segundo | California | 285,000 | operating |
| 19 | Phillips 66 Company | Sweeny | Texas | 277,000 | operating |
| 20 | Phillips 66 Company | Linden | New Jersey | 275,000 | operating |
| 21 | ExxonMobil Refining & Supply Co | Joliet | Illinois | 267,000 | operating |
| 22 | Phillips 66 Company | Westlake | Louisiana | 263,700 | operating |
| 23 | Marathon Petroleum Co LP | Robinson | Illinois | 253,000 | operating |
| 24 | Chevron USA Inc | Richmond | California | 245,271 | operating |
| 25 | BP Products North America Inc | Ferndale | Washington | 238,500 | operating |
| 26 | TotalEnergies Petrochem & Refining USA | Port Arthur | Texas | 238,000 | operating |
| 27 | Shell Oil Products US | Norco | Louisiana | 231,153 | operating |
| 28 | Phillips 66 Company | Ponca City | Oklahoma | 228,000 | operating |
| 29 | Valero Refining Co Texas LP | Texas City | Texas | 225,000 | operating |
| 30 | Valero Refining New Orleans LLC | Norco | Louisiana | 215,000 | operating |
| 31 | Valero Refining Co Texas LP | Houston | Texas | 205,000 | operating |
| 32 | Diamond Shamrock Refining Co LP | Sunray | Texas | 195,000 | operating |
| 33 | Chalmette Refining LLC | Chalmette | Louisiana | 190,000 | operating |
| 34 | Monroe Energy LLC | Trainer | Pennsylvania | 190,000 | operating |
| 35 | PDV Midwest Refining LLC | Lemont | Illinois | 188,023 | operating |
| 36 | Lima Refining Company | Lima | Ohio | 183,000 | operating |
| 37 | Valero Refining Company Tennessee LLC | Memphis | Tennessee | 180,000 | operating |
| 38 | Toledo Refining Co LLC | Toledo | Ohio | 172,800 | operating |
| 39 | Delaware City Refining Co LLC | Delaware City | Delaware | 171,000 | operating |
| 40 | CITGO Refining & Chemical Inc | Corpus Christi | Texas | 165,000 | operating |
| 41 | HF Sinclair El Dorado Refining LLC | El Dorado | Kansas | 162,000 | operating |
| 42 | Paulsboro Refining Co LLC | Paulsboro | New Jersey | 160,000 | operating |
| 43 | Torrance Refining Co LLC | Torrance | California | 160,000 | operating |
| 44 | Martinez Refining Co LLC | Martinez | California | 156,400 | operating |
| 45 | Ohio Refining Company LLC | Toledo | Ohio | 150,800 | operating |
| 46 | WRB Refining LP | Borger | Texas | 149,000 | operating |
| 47 | Marathon Petroleum Co LP | Detroit | Michigan | 146,000 | operating |
| 48 | HF Sinclair Puget Sound Refining LLC | Anacortes | Washington | 145,000 | operating |
| 49 | Valero Refining Co California | Benicia | California | 145,000 | operating on January 1, idled in April 2026 |
| 50 | Calcasieu Refining Co | Lake Charles | Louisiana | 135,500 | operating |
| 51 | Western Refining Company LP | El Paso | Texas | 133,000 | operating |
| 52 | CVR Refining CVL LLC | Coffeyville | Kansas | 132,000 | operating |
| 53 | Valero Refining – Meraux LLC | Meraux | Louisiana | 125,000 | operating |
| 54 | CHS McPherson Refinery Inc | McPherson | Kansas | 119,000 | operating |
| 55 | Tesoro Refining & Marketing Co | Anacortes | Washington | 119,000 | operating |
| 56 | Pasadena Refining Systems Inc | Pasadena | Texas | 118,750 | operating |
| 57 | HF Sinclair Navajo Refining LLC | Artesia | New Mexico | 110,000 | operating |
| 58 | Kinder Morgan Crude & Condensate | Galena Park | Texas | 105,000 | operating |
| 59 | Phillips 66 Company | Ferndale | Washington | 105,000 | operating |
| 60 | St Paul Park Refining Co LLC | Saint Paul | Minnesota | 105,000 | operating |
| 61 | Marathon Petroleum Co LP | Canton | Ohio | 100,000 | operating |
| 62 | Par Hawaii Refining LLC | Kapolei | Hawaii | 93,500 | operating |
| 63 | Diamond Shamrock Refining Co LP | Three Rivers | Texas | 89,000 | operating |
| 64 | Vertex Refining Alabama LLC | Saraland | Alabama | 88,000 | operating |
| 65 | Flint Hills Resources LP | Corpus Christi East | Texas | 87,500 | operating |
| 66 | Valero Refining Co Oklahoma | Ardmore | Oklahoma | 86,000 | operating |
| 67 | HF Sinclair Tulsa Refining LLC | Tulsa West | Oklahoma | 85,000 | operating |
| 68 | Ultramar Inc | Wilmington Refinery | California | 85,000 | operating |
| 69 | Lion Oil Co | El Dorado | Arkansas | 83,000 | operating |
| 70 | Alon Refining Krotz Springs Inc | Krotz Springs | Louisiana | 80,000 | operating |
| 71 | HF Sinclair Wyoming Refining Co | Sinclair | Wyoming | 75,000 | operating |
| 72 | Placid Refining Co | Port Allen | Louisiana | 75,000 | operating |
| 73 | CVR Refining WYN LLC | Wynnewood | Oklahoma | 74,500 | operating |
| 74 | Delek Refining Ltd | Tyler | Texas | 74,000 | operating |
| 75 | Alon USA Energy Inc | Big Spring | Texas | 73,000 | operating |
| 76 | Tesoro Refining & Marketing Co | Mandan | North Dakota | 72,000 | operating |
| 77 | Phillips 66 Company | Billings | Montana | 71,000 | operating |
| 78 | HF Sinclair Tulsa Refining LLC | Tulsa East | Oklahoma | 70,300 | operating |
| 79 | Tesoro Refining & Marketing Co | Salt Lake City | Utah | 70,000 | operating |
| 80 | Tesoro Alaska Company LLC | Kenai | Alaska | 68,000 | operating |
| 81 | Suncor Energy (USA) Inc | Commerce City West | Colorado | 67,000 | operating |
| 82 | United Refining Co | Warren | Pennsylvania | 67,000 | operating |
| 83 | Cenex Harvest States Coop | Laurel | Montana | 62,500 | operating |
| 84 | Petro Star Inc | Valdez | Alaska | 62,500 | operating |
| 85 | Par Montana LLC | Billings | Montana | 61,500 | operating |
| 86 | Buckeye Texas Processing LLC | Corpus Christi | Texas | 60,000 | operating |
| 87 | Calumet Shreveport Refining LLC | Shreveport | Louisiana | 57,000 | operating |
| 88 | Chevron USA Inc | Salt Lake City | Utah | 54,720 | operating |
| 89 | Hunt Refining Co | Tuscaloosa | Alabama | 50,000 | operating |
| 90 | Magellan Processing LP | Corpus Christi | Texas | 50,000 | operating |
| 91 | Superior Refining Company LLC | Superior | Wisconsin | 49,547 | operating |
| 92 | Hartree Refining LLC | Channelview | Texas | 45,000 | operating |
| 93 | Texas International Terminals | Galveston | Texas | 45,000 | operating |
| 94 | HF Sinclair Woods Cross Refining LLC | Woods Cross | Utah | 41,705 | operating |
| 95 | US Oil & Refining Co | Tacoma | Washington | 40,700 | operating |
| 96 | Countrymark Refining & Logistics LLC | Mount Vernon | Indiana | 36,700 | operating |
| 97 | Suncor Energy (USA) Inc | Commerce City East | Colorado | 36,000 | operating |
| 98 | CPI Operations LLC | Paulsboro | New Jersey | 32,000 | idle |
| 99 | Big West Oil Co | North Salt Lake | Utah | 31,664 | operating |
| 100 | HF Sinclair Casper Refining Company | Evansville | Wyoming | 31,000 | operating |
| 101 | Ergon Refining Inc | Vicksburg | Mississippi | 26,500 | operating |
| 102 | Kern Oil & Refining Co | Bakersfield | California | 26,000 | operating |
| 103 | Petro Star Inc | North Pole | Alaska | 25,000 | operating |
| 104 | Petromax Refining Co LLC | Houston | Texas | 25,000 | operating |
| 105 | Ergon West Virginia Inc | Newell | West Virginia | 22,300 | operating |
| 106 | The San Antonio Refinery LLC | San Antonio | Texas | 20,000 | operating |
| 107 | Wyoming Refining Co | Newcastle | Wyoming | 18,000 | operating |
| 108 | Calumet Montana Refining LLC | Great Falls | Montana | 15,000 | operating |
| 109 | ConocoPhillips Alaska Inc | Prudhoe Bay | Alaska | 15,000 | operating |
| 110 | San Joaquin Refining Co Inc | Bakersfield | California | 15,000 | operating |
| 111 | Silver Eagle Refining | Woods Cross | Utah | 15,000 | operating |
| 112 | Lazarus Energy LLC | Nixon | Texas | 14,000 | operating |
| 113 | Calumet Cotton Valley Refining LLC | Cotton Valley | Louisiana | 13,020 | operating |
| 114 | American Refining Group Inc | Bradford | Pennsylvania | 11,000 | operating |
| 115 | Hunt Southland Refining Co | Sandersville | Mississippi | 11,000 | operating |
| 116 | Lunday Thagard Co | South Gate | California | 8,500 | operating |
| 117 | Calumet Princeton Refining LLC | Princeton | Louisiana | 8,300 | operating |
| 118 | Cross Oil Refining & Marketing Inc | Smackover | Arkansas | 7,500 | operating |
| 119 | Hilcorp North Slope LLC | Prudhoe Bay | Alaska | 6,500 | operating |
| 120 | Valero Refining Co California | Wilmington Asphalt Plant | California | 6,300 | operating |
| 121 | Goodway Refining LLC | Atmore | Alabama | 4,100 | operating |
| 122 | Silver Eagle Refining | Evanston | Wyoming | 3,000 | operating |
| 123 | Foreland Refining Corp | Ely | Nevada | 2,000 | idle |
| 124 | Talley Asphalt Products Inc | Kern | California | 1,700 | operating |
| 125 | Enterprise Prod Texas Operating LLC | Mont Belvieu | Texas | 0 | no crude unit |
| 126 | Equistar Chemicals LP | Channelview | Texas | 0 | no crude unit |
| 127 | Excel Paralubes | Westlake | Louisiana | 0 | no crude unit |
| 128 | Pasadena Performance Products LLC | Pasadena | Texas | 0 | no crude unit |
| 129 | Targa Downstream LLC | Mont Belvieu | Texas | 0 | no crude unit |
| 130 | Trecora Hydrocarbons LLC | Silsbee | Texas | 0 | no crude unit |
What this count does not prove
The year 1982 is where the EIA table starts, not a demonstrated peak. This page makes no claim about the years before it, and the 56.8% fall in the count is a fall from that starting line.
An operable refinery is not a busy one. The count says a site could run. How hard the fleet actually runs is tracked in the weekly US refinery utilization dataset, with the thresholds explained in how to read the utilization rate.
The 1.5% rise depends on its endpoints. Capacity peaked at 18,976,085 b/cd in 2020 and has fallen 4.3% since, so a reader starting from 2020 sees a decline where a reader starting from 1982 sees a small gain. Both readings come from the same column.
The count also says nothing about how fuel moves between regions: Texas and Louisiana hold 50.3% of capacity, California 8.3%. Why any one site runs or closes is outside the table too. Margins are one input, covered in the crack spread against refinery utilization.
Questions
How many oil refineries are in the US?
The EIA counted 130 operable refineries on January 1, 2026, of which 128 were operating and 2 were idle. Six of the 130 have no atmospheric distillation unit, so 124 report crude distillation capacity.
How many refineries are in California?
The EIA counted 12 on January 1, 2026, with 1,499,171 b/cd, or 8.3% of US capacity, down from 43 in 1982. The 12 include Valero’s Benicia site, which Valero says was fully idled in April 2026, and exclude Phillips 66 in Los Angeles, which last operated in October 2025.
How many refineries are in Texas?
The EIA counted 34 on January 1, 2026, 29 of them with a crude distillation unit. They hold 6,134,650 b/cd, or 33.8% of US capacity. Texas had 65 in 1982.
When was the last refinery built in the US?
According to the EIA, the newest is Texas International Terminals in Galveston, 45,000 b/cd, which started operating in February 2022. The newest with significant downstream units is Marathon’s Garyville, Louisiana, plant, online in 1977 at 200,000 b/cd and at 617,000 b/cd on January 1, 2026. Hydrocarbon Processing reported in March 2026 that America First Refining plans a new site at the Port of Brownsville, Texas. It is not built and is not in the count.
What is the largest refinery in the US?
Motiva Enterprises LLC in Port Arthur, Texas, with 656,400 b/cd on January 1, 2026. Marathon’s Galveston Bay plant follows at 631,000 b/cd, then Marathon’s Garyville at 617,000 b/cd and ExxonMobil’s Beaumont at 612,000 b/cd.
Method
National counts and capacity come from the EIA’s annual table, state figures from its table by area, and the 130 sites from the Refinery Capacity Report 2026 file. Every state column was summed and matched to the national total for each year, and each state’s sites were matched to its 2026 count, with no difference. The EIA ran no survey for 1996 or 1998, so the CSV leaves both years blank and the charts break there. Capacity is barrels per calendar day. Data retrieved November 5, 2026, under the EIA’s copyright and reuse terms.
Last updated — 6 November 2026
Disclaimer – Financial and Legal Information: The analyses, commentary, and content published on eco3min.fr are provided for informational and educational purposes only. They do not constitute investment advice or a solicitation to buy or sell financial instruments. Past performance is not indicative of future results. All investment decisions involve risk and are the sole responsibility of the reader. Data, charts and calculated series are provided as is and may contain errors or lag behind their source: check any figure against the primary source cited before relying on it. Content describing laws, regulations or contracts reflects the law as of its publication date and does not constitute legal or tax advice; applying it to a specific situation requires a qualified legal or tax professional.