
Percentage of income spent on food in the US, at home and away, 1929 to 2025
Where the US food dollar goes
Pick a year: the card sets every count of that year side by side.
Download the data (CSV, 1929-2025)
TL;DR. US households spent 9.65% of disposable income on food in 2025, down from 18.98% in 1954, and about half of it went to food away from home on USDA’s count.
- Since 1954, food at home fell from 15.57% of income to 4.79%. Food away from home went from 3.41% to 4.87%.
- Share of food spending away from home in 2025: 50.4% for USDA, 39.0% for the BLS household survey. The two counts stayed within 2.3 points of each other from 1997 to 2007.
- From 1997 to 2025, USDA’s share gains 8.9 points in current dollars and 3.8 in constant dollars.
The percentage of income spent on food in the US was 9.65% of disposable personal income in 2025: 4.79% at home and 4.87% away from home, in the Food Expenditure Series of the USDA Economic Research Service (ERS), advance estimate. ERS rounds the total to 9.7% on its chart page. The figure was 9.71% in 2024 and 25.00% in 1933, the highest since the table starts in 1929. It divides national food spending by national disposable income, so it describes the country and says nothing about a typical household.
| Year | All food | At home | Away from home | ERS method |
|---|---|---|---|---|
| 1929 | 23.40 | 20.26 | 3.13 | Pre-2018 |
| 1933 | 25.00 | 21.77 | 3.23 | Pre-2018 |
| 1954 | 18.98 | 15.57 | 3.41 | Pre-2018 |
| 1970 | 13.39 | 9.92 | 3.47 | Pre-2018 |
| 1996 | 10.39 | 6.42 | 3.98 | Pre-2018 |
| 1997 | 10.37 | 6.06 | 4.31 | Current |
| 2010 | 9.63 | 5.31 | 4.32 | Current |
| 2021 | 9.19 | 4.87 | 4.32 | Current |
| 2024 | 9.71 | 4.86 | 4.85 | Current |
| 2025 | 9.65 | 4.79 | 4.87 | Current |
Percent of US disposable personal income, household final users, current dollars, taxes and tips included, alcohol excluded. 2025 is an advance estimate. The two methods are not spliced; where they overlap, the current total differs from the old one by -0.13 to +0.36 point. At home and away are rounded separately and may not add exactly to the total. Source: USDA ERS, Food Expenditure Series.
The chart at the top runs on a year slider. Move it and the card underneath lines up every count for that year: USDA households in current and constant dollars, USDA all purchasers, the BLS household survey, the share of income and the dollars. The tabs switch between the food dollar, the share of income back to 1929, and the four counts on one chart.
Key figures at a glance
Share of income: 23.40% (1929), high 25.00% (1933), 18.98% (1954), 10.39% (1996), low of the current method 9.19% (2021), 9.65% (2025)
Away from home, share of food spending, USDA households: 18.0% (1954), 38.2% (1996), 41.5% (1997), 51.4% (2018), 46.7% (2020), 49.97% (2024), 50.42% (2025)
Same share, BLS survey: 40.1% (1984), 44.4% (2005), 32.5% (2020), 39.0% (2025)
Dollars, 2025: $8,260 away and $8,123 at home per household (USDA, average); $4,142 and $6,491 per consumer unit (BLS, average)
Sources: USDA ERS, Food Expenditure Series, page updated November 5, 2026; BLS, Consumer Expenditures, 2025, released October 29, 2026; all fetched November 6, 2026.
What the ratio counts
ERS adds up what households spend on food and divides by disposable personal income. The spending side is built mostly from what businesses report selling: 96.7% of the at-home estimates and 78.2% of the away-from-home estimates rest on Census data, according to ERS’s 2018 methodology report. At home, the series counts who eats the food rather than who pays for it: groceries bought with SNAP or WIC count as household use. Away from home the line is less clean. ERS’s documentation names households as final users of school lunches too, yet the published household shares only add up with government-paid food away from home left out, $52.4 billion in 2025 (Eco3min check against ERS’s final-purchaser table, within 0.05 point every year since 1997). Sales taxes and tips are in, and alcohol is a separate category left out here.
The label misleads. ERS defines food away from home as prepared meals and snacks for immediate consumption, sold by restaurants of every kind, drinking places, hotels, retail stores, recreational places, schools and colleges. The BLS glossary places take-out and delivery in the same category. On that definition, a pizza delivered to the sofa is food away from home.
A quarter of income in 1933, under a tenth in 2025
The two ERS methods stay within 0.36 point of each other on this ratio where they overlap, so the long decline does not hinge on the method change. Falling food shares as incomes rise are the pattern known as Engel’s law. This series shows the ratio and cannot say how much of the fall comes from income and how much from food prices.
Groceries account for more than the whole fall. Food at home took 15.57% of income in 1954 and 4.79% in 2025, the lowest in the table. Food away from home went from 3.41% to 4.87%, and it has stayed between 2.95% and 5.26% of income in every year since 1929. Against income, eating out gained 1.5 points while groceries lost 10.8. That comparison crosses the method change, which moves the away column by 0.24 to 0.49 point and the at-home column by 0.04 to 0.45 point where both exist.
The national ratio also hides a wide range. ERS reports that in 2024 households in the lowest income quintile spent $5,498 on food, 33.0% of before-tax income, those in the middle quintile $9,097, 12.2%, and those in the highest $16,989, 6.4%. Those shares rest on before-tax income and on a different spending count: USDA’s own average for all households in 2024 is $16,090, close to the highest quintile here. The two sets do not line up directly. Household income percentiles by age give a sense of where a given household sits. All of these figures describe what was spent and set no budget norm.
Where the food dollar goes, 1954 to 2025
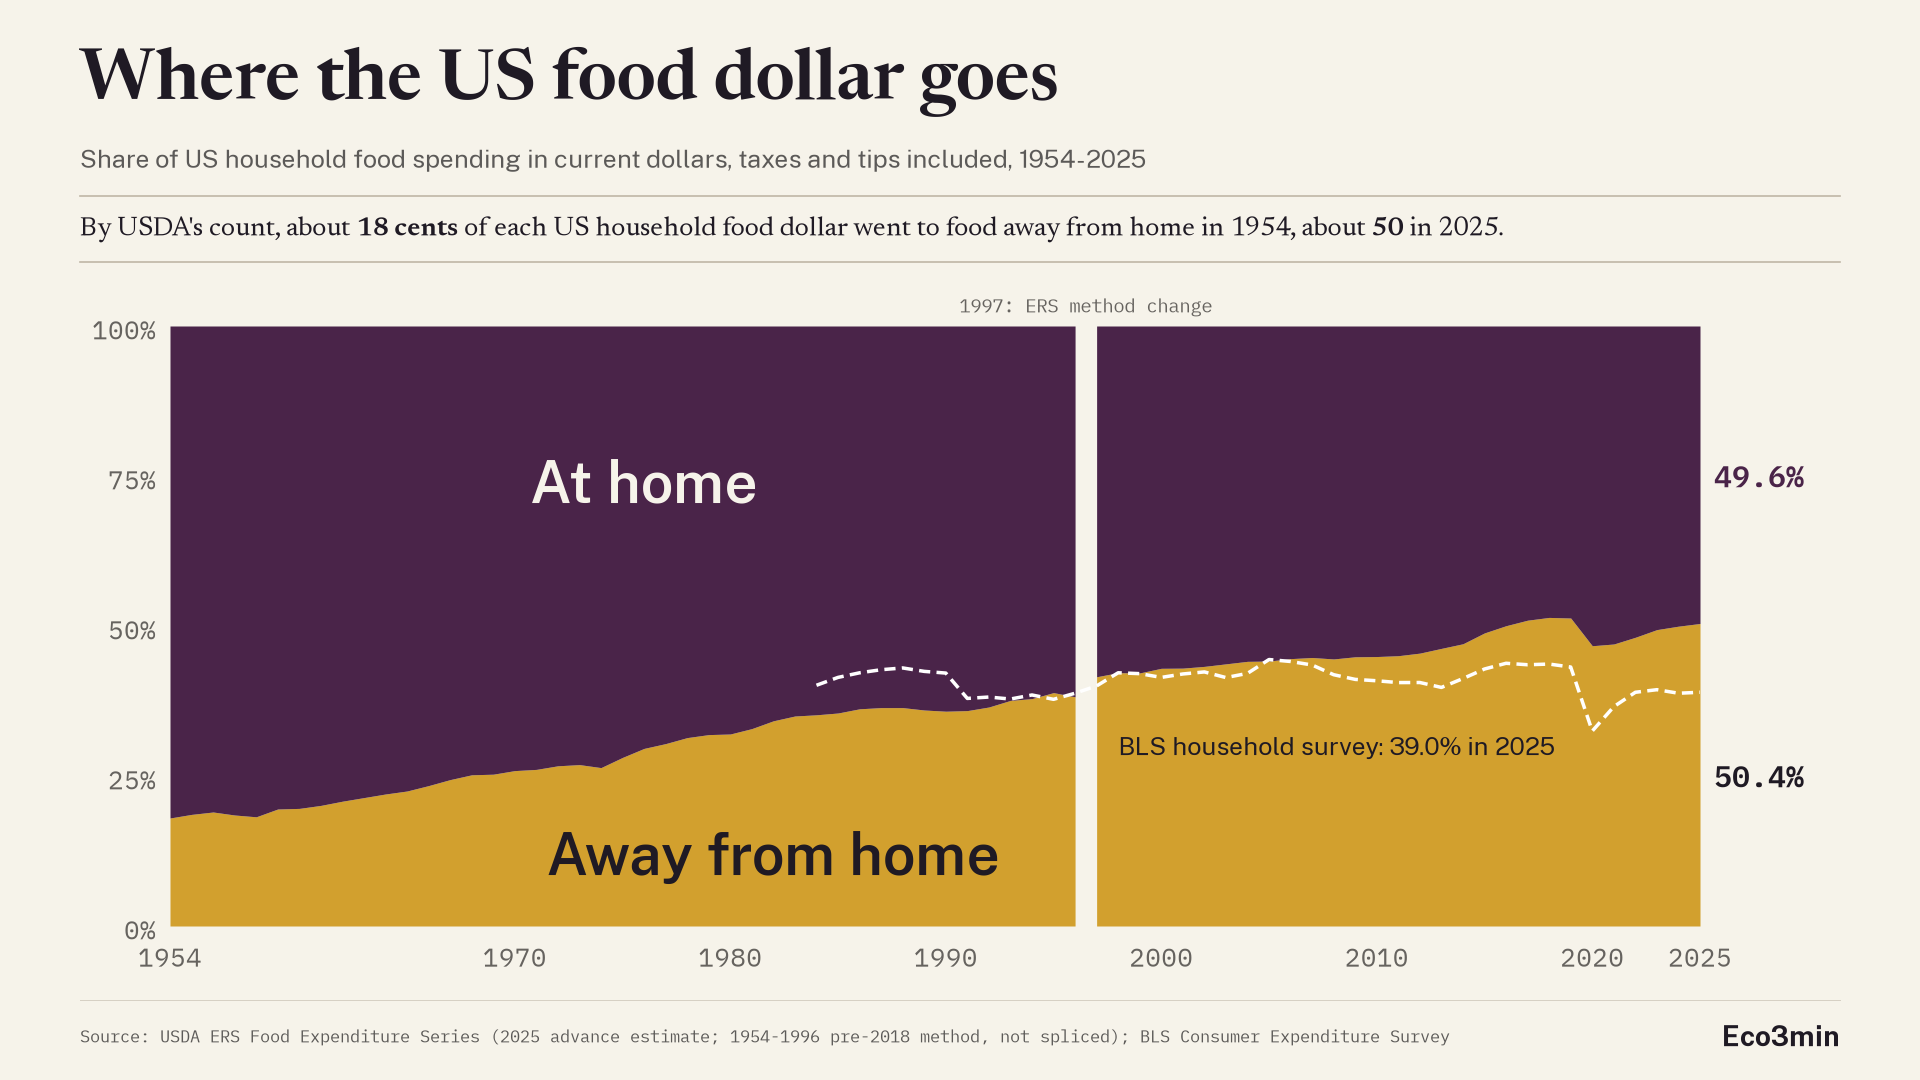
By USDA’s count, about 18 cents of each household food dollar went to food away from home in 1954, about 50 in 2025. The share reaches 38.2% in 1996, then steps to 41.5% in 1997 when the method changes, which is the white gap in the chart. ERS revised its series back to 1997 only, and where both methods exist the current one runs 2.06 to 3.97 points higher. What that gap would be in 1954 is unknown, so the two ends of the chart are not on the same ruler. On the old method the share never reached 50%: it was 43.7% in 2014, that method’s last year.
On the current method the share passes 50% in 2016, peaks at 51.4% in 2018 and drops to 46.7% in 2020. It then reads 49.97% in 2024 and 50.42% in 2025, an advance estimate based on incomplete source data. Nothing happens at 50%, and the chart draws no line there: it is only where the two bands meet. Food away from home tops food at home in dollars on this count in five of the ten years from 2016 to 2025, and never by more than 2.9 points of food spending. That count can still change: 2025 is an advance estimate, and 2024, at 49.97%, a revised one that ERS has not finalised. It is also a wider test than restaurants against groceries, because the household count has no split by outlet. ERS’s all-purchaser table, which includes businesses and government, puts full-service and limited-service restaurants at $1,004.5 billion in 2025, against $1,096.8 billion for all food at home and $616.5 billion at grocery stores alone. Restaurants stay under all food at home in every year since 1997.
The chart starts in 1954 because ERS publishes this share of food spending from that year. Before 1954 it gives the two categories only as shares of income. Dividing one by the other, an Eco3min calculation, gives 13.4% in 1929, 19.5% in 1945 and 17.5% in 1953. The climb did not begin in 1954.
Two federal counts, close until 2007, 11 points apart in 2025
The Bureau of Labor Statistics measures the same split from the other side, mostly through weekly diaries that households fill in for its Consumer Expenditure Survey. On USDA’s current method the two counts stayed within 2.3 points of each other from 1997 to 2007, and in 2005 they were almost the same, 44.2% for USDA and 44.4% for BLS. The BLS share was 40.1% in 1984, peaked in 2005, fell to 32.5% in 2020 and was 39.0% in 2025. It never reaches 50%. USDA’s lead then widened: 4.0 points in 2010, 8.2 in 2019, 14.2 in 2020, 9.2 in 2022 and 11.5 in 2025. On USDA’s older method, the one charted before 1997, the BLS share runs higher in every year from 1984 to 1996 except 1995, by up to 6.6 points, so the ranking itself has changed.
| Share of food spending away from home (%) | 1997 | 2005 | 2017 | 2020 | 2025 |
|---|---|---|---|---|---|
| USDA ERS, households, current dollars | 41.5 | 44.2 | 51.0 | 46.7 | 50.4 |
| USDA ERS, households, constant 2025 dollars | 46.6 | 48.6 | 53.0 | 47.7 | 50.4 |
| USDA ERS, all purchasers, businesses and government included | 47.4 | 50.2 | 56.6 | 51.8 | 56.3 |
| BLS Consumer Expenditure Survey, per consumer unit | 40.0 | 44.4 | 43.5 | 32.5 | 39.0 |
Eco3min calculation for the BLS row and the constant-dollar row, away divided by at home plus away. 2025: USDA advance estimate; BLS Diary data missing for October and November. Source: USDA ERS, Food Expenditure Series; BLS, Consumer Expenditure Survey.
What the agencies have written stops short of a verdict. ERS’s report calls its series “most comparable in size and growth” to Personal Consumption Expenditures (PCE), the national accounts measure, and says the two use similar source data, while the BLS estimates “are based on household weekly diaries”. ERS’s comparison table also lists differences in scope for its series as a whole: business meals are in ERS and out of BLS, and school and college meals come at revenue plus federal reimbursements against out-of-pocket spending. The documents read do not say which of these reach the household share, or by how much. BLS’s own comparison workbook sets its survey at 525,226 of PCE’s 1,030,607 million dollars for purchased meals and beverages in 2022 (0.51), and at 659,176 of 1,045,570 for food bought for off-premises consumption (0.63). BLS puts its survey’s deviations from PCE, across all spending, down to “coverage, definitional, and measurement differences”.
Neither agency publishes a breakdown of the USDA-BLS gap in the documents read for this page, and none of them explains why it widened after 2007. That leaves at least three readings, and the published data do not separate them. In the first, household diaries miss meals out more than groceries. The workbook’s ratio for meals sat above its ratio for groceries in 2007 (0.69 against 0.65) and below it in 2019 (0.61 against 0.68). A BLS working paper lists “difficulties in recalling expenditures” among the explanations of the level, for spending of all kinds and in its authors’ own view. It does not single out meals: from 1992 to 2010, it gives food for off-premise consumption and food services and accommodations about 10 percent each of the wider distance from PCE. In the second, survey response could matter. For the BLS survey against PCE across all spending, a distance that widened mostly from 1992 to 2003, the same paper says that if the added nonresponse fell disproportionately on higher-income, higher-consumption households “this could help explain the widening disparities”. “No direct information bears on this question”, it adds, and the response rates it cites are those of the Interview survey, not the diaries. In the third, the two series do not capture the same transactions, in ways the documents read do not size, and the paper notes that PCE, which uses similar source data to ERS, is also subject to error.
ERS also keeps a wider count that adds food paid for by businesses and government. On that basis the away-from-home share was 25.0% in 1954 on the old method. On the current method it has been above 50% every year since 2004 and reached 56.3% in 2025. The old method crosses 50% only in 2014, and ERS’s 2018 report put the crossing in 2010 on the tables of that time. ERS’s monthly sales table, all purchasers and sales only, gives 54.0% for January to August 2025 and 54.2% for the same months of 2026. Neither compares directly with a household share.
All of these are shares of dollars, so a restaurant meal that costs more raises the share without anyone eating out more often. The BLS price index for food away from home (CUSR0000SEFV) over food at home (CUSR0000SAF11), set to 100 in 1954, stands at 136.1 in 1996, 167.9 in 2025 and 169.6 for the first nine months of 2026, through September. The 2025 figure averages 11 months, since BLS has no index for October 2025.
ERS also publishes constant 2025 dollars, which take that price drift out. The away-from-home share then reads 46.6% in 1997, 53.0% in 2017, 47.7% in 2020 and 50.4% in 2025. From 1997 to 2025 it gains 3.8 points against 8.9 in current dollars, and its high comes before the pandemic. Constant dollars still count no meals, and no series here says how many people eat out or how often. Food is one line of the US consumption basket since 1929.
How much Americans spend on eating out
In dollars, the two agencies are further apart on food away from home than on food at home. USDA’s 2025 estimate comes to $8,260 per household, about $688 a month. The BLS survey gives $4,142 per consumer unit, about $345 a month. Scaled to national totals with BLS’s 137,994 thousand consumer units, an Eco3min calculation, the survey comes to 0.82 of USDA’s figure for food at home and 0.51 for food away from home.
| 2025, dollars a year | At home | Away from home | All food | Away, per month |
|---|---|---|---|---|
| USDA ERS, per household | $8,123 | $8,260 | $16,384 | $688 |
| BLS survey, per consumer unit | $6,491 | $4,142 | $10,633 | $345 |
Averages. USDA: national spending divided by households, advance estimate. BLS: survey mean per consumer unit. Per month: the yearly figure divided by twelve, Eco3min calculation.
Both are averages, not medians, so large spenders pull them up. Neither table reports a typical household, and households and consumer units are not the same count. BLS publishes its survey by income group for anyone comparing a bracket.
What the series leaves out
The last year can move. 2025 is an ERS advance estimate on incomplete source data, and annual data are revised each June. ERS adds that its June 2026 revision, which brought in the 2023 Annual Integrated Economic Survey, affected comparability between 2021-22 and 2023 for some industries, and that it adjusted the affected estimates to smooth the transition. The household share moves from 48.12% in 2022 to 49.40% in 2023, and every change that spans those years, 1997 to 2025 included, carries that caveat.
The BLS 2025 figures carry their own gap. Diary data are missing entirely for October and November 2025, and BLS doubled the weights of September and December to cover those months.
National totals weigh high earners more than anyone else. The series counts dollars and gives no reasons. Constant dollars isolate prices, and nothing here separates what remains, whether delivery apps, two-earner households or anything else. Related pages follow inflation regimes, food prices and social unrest and real commodity prices since 1960.
Methodology and sources
USDA. U.S. Department of Agriculture, Economic Research Service. Food Expenditure Series, page updated November 5, 2026, annual tables of June 1, 2026, fetched November 6, 2026. Household final users, taxes and tips included, alcohol excluded. 1929 to 1996: previously published estimates (pre-2018 method). 1997 to 2025: current method. “Food dollar” here is the everyday phrase and has nothing to do with ERS’s Food Dollar Series, which divides spending between farms and the rest of the supply chain.
BLS. Consumer Expenditure Survey, series CXUFOODHOMELB0101M and CXUFOODAWAYLB0101M through FRED, plus the 2025 values from the BLS public API because FRED stops at 2024. Share away from home = away / (at home + away), an Eco3min calculation. CPI series through FRED, seasonally adjusted, annual means of monthly indexes.
Methods report. Okrent, Elitzak, Park and Rehkamp, Measuring the Value of the U.S. Food System: Revisions to the Food Expenditure Series, TB-1948, USDA ERS, September 2018. Its text gives two conflicting averages for PCE and its own series, so neither is cited here.
Workbook. In the BLS comparison workbook, the printed 2022 ratio on the purchased-meals row reads 0.31 and does not match its two components. The 0.51 cited above is computed from the dollars. The row is “purchased meals and beverages”, whose scope is not identical to food away from home.
Rounding. Shares at one decimal, half up, except where two decimals change the reading. The interactive card shows at home as 100 minus away.
Reproducibility. The CSV is built by script from the ERS tables and the FRED and BLS APIs; no value is typed in, and every row names its method and source. The chart is produced with Python (matplotlib), the interactive version in plain SVG.
Frequently asked questions
What percentage of income do Americans spend on food?
9.65% of disposable personal income in 2025, 4.79% at home and 4.87% away from home, in the USDA ERS Food Expenditure Series (advance estimate). It was 10.37% in 1997 on the same method and 18.98% in 1954 on the earlier one.
How much do Americans spend on eating out?
About $8,260 per household in 2025 on USDA’s count, roughly $688 a month, and $4,142 per consumer unit in the BLS survey, roughly $345 a month. Both are averages.
Do Americans spend more on eating out than on groceries?
On USDA’s household count, slightly, in 2025: 50.42% of food spending away from home against 49.58% at home, an advance estimate. In the BLS survey, no: 39.0% away from home, with Diary data missing for October and November. Both take food away from home as a whole, which is wider than restaurants.
What counts as food away from home?
For ERS, prepared meals and snacks for immediate consumption, from restaurants, drinking places, hotels, retail stores, recreational places, schools and colleges. BLS includes take-out and delivery, so where the food is eaten does not decide the category.
Why do USDA and BLS give different numbers?
USDA builds its series mostly from what businesses report selling, BLS mostly from weekly household diaries. In the documents read for this page, neither agency breaks the gap down. It stayed within 2.3 points from 1997 to 2007 and was 11.5 points in 2025.
ERS reports 33.0% of before-tax income for the lowest income quintile in 2024, 12.2% for the middle quintile and 6.4% for the highest. The 9.65% national figure uses disposable income and national totals, so it does not line up directly with these.
Download the complete dataset
One CSV file, 1929 to 2025, one row per year and method. Share of income, share of food spending, dollars per household, constant 2025 dollars, all purchasers, the BLS survey, relative prices, with the status and source of each row.
Sources: U.S. Department of Agriculture, Economic Research Service, Food Expenditure Series; U.S. Bureau of Labor Statistics.
Next data
ERS publishes annual tables each June, so the 2025 advance estimate can move in June 2027, when 2026 joins the table. The first thing to read then is how far the 49.97% of 2024 and the 50.42% of 2025 move on USDA’s household count. The distance to the BLS survey, 11.5 points for 2025, can move with that revision and gets a 2026 reading only with BLS’s next annual release; the 2025 figures came out on October 29, 2026.
Last updated — 6 November 2026
Disclaimer – Financial and Legal Information: The analyses, commentary, and content published on eco3min.fr are provided for informational and educational purposes only. They do not constitute investment advice or a solicitation to buy or sell financial instruments. Past performance is not indicative of future results. All investment decisions involve risk and are the sole responsibility of the reader. Data, charts and calculated series are provided as is and may contain errors or lag behind their source: check any figure against the primary source cited before relying on it. Content describing laws, regulations or contracts reflects the law as of its publication date and does not constitute legal or tax advice; applying it to a specific situation requires a qualified legal or tax professional.