
Time machine · US personal consumption, 1929–2025
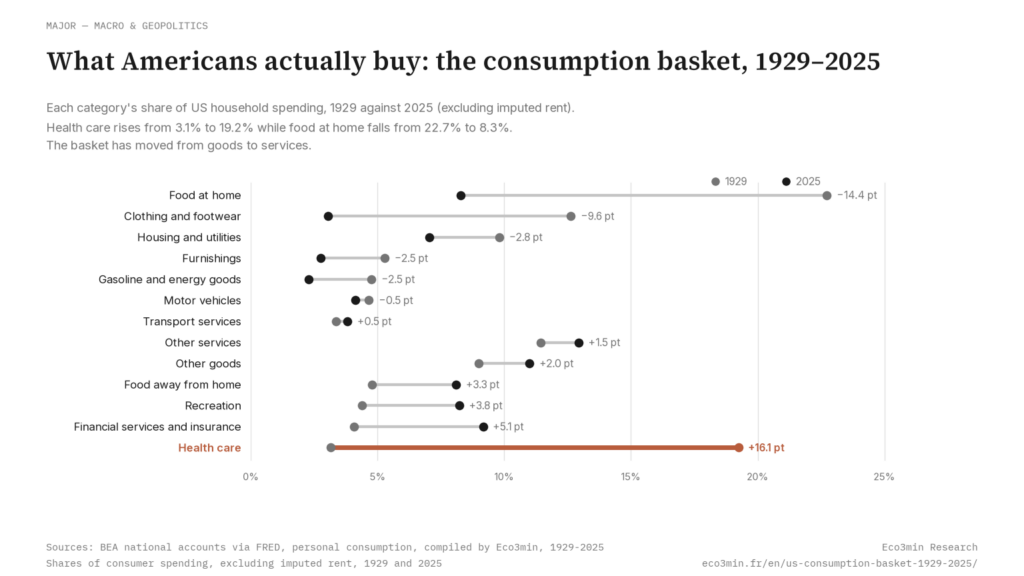
What Americans actually buy: the consumption basket, 1929–2025
Drag the timeline and watch the American spending basket deform. Food at home falls from more than a fifth of consumption to under a tenth. Health care rises from almost nothing to the largest single line. Every year you pass leaves a ghost mark, so the whole century accumulates on screen.
How to read this
Each row is one line of American consumption spending, measured as a share of the total. The bar is the year on the timeline. The pale ticks behind it are every year you have already passed, so after a full run each row shows the entire envelope its share has occupied since 1929. The strip at the top is the same year as a single basket adding to 100 %. The number on the left is the rank of that category in that year, which is where the drama sits: health care starts thirteenth and ends first.
A bar turns pink when that year is the highest or the lowest reading of the whole series for that category.
Why the composition moves
Two forces drive it, and they pull in different directions. The first is volume: households buy different things as income rises. Food eaten at home takes 22.7 % of spending in 1929 and 8.3 % in 2025 — not because food got cheap in any simple sense, but because everything else grew around it. The second is price: a share is spending, so a category whose price falls relative to others can lose weight even when households buy more of it. Clothing does both at once, sliding from 12.6 % to 3.0 %, with its record low of 2.9 % in 2020.
Health care runs the other way and passes food at home in 1986. By 2025 it is the largest single line at 19.2 %.
Measured inflation and felt inflation
The gap between the published inflation rate and the one people feel is often blamed on the weights. The weights are part of it, but the mechanism is narrower than the accusation usually implies, and it is checkable.
A weight is an average across all households. A renter in a large city and an outright owner in a small one do not share a basket, and neither of them is the average. A statistical index measures the average household, which is nobody. Second, spending shares respond to prices: when the relative price of a service falls, its share can shrink, and it then carries less influence in the index — the decline was real, and so is the smaller weight, but the two facts feel contradictory when they are reported separately. Third, several lines in the national accounts are not paid by households at the till: imputed rent for owner-occupiers, and health care largely paid by employers and public programmes. That is why this page has a toggle: excluding imputed rent moves housing from 18.1 % to 7.0 % in 2025.
What the data does not support is the idea that the composition is manufactured to suppress the headline. The weights are published every year, the underlying spending series are open, and the deformation shown here runs for nearly a century through administrations of every kind, following the shape one would expect from rising incomes: less food, less clothing, more services. Anyone can rebuild it from the file below.
What this is, and what it is not
This is the structure of personal consumption expenditures from the national accounts — the raw material from which statistical agencies draw the weights they use. It is not the published CPI basket. The CPI is built on the Consumer Expenditure Survey, covers urban households, and uses a different item structure; its major-group series is only continuous back to the 1998 revision, when telephone service moved out of housing into a newly created education and communication group. Relative importance tables in machine-readable form start in December 1987. A century-long view of the CPI basket does not exist.
Consumption expenditures also include imputations households never hand over: imputed rent, treated with the toggle, and financial services furnished without payment, which remains inside finance and insurance. Health care here is total spending on behalf of households, not out-of-pocket cost. These are properties of the accounting framework, not corrections applied for effect, and they are the honest reason a national aggregate will never match a household receipt.
Go further
- Inflation: the complete guide
- US inflation history — dataset
- US core CPI — dataset
- Inflation regimes and structural drivers
- How the French statistics office builds its index
- The same machine, for France (in French)
Source: US Bureau of Economic Analysis, National Income and Product Accounts, personal consumption expenditures by type of product, annual, current dollars, retrieved from FRED.
Page built August 2026. Series retrieved 20 August 2026.
Last updated — 23 September 2026
Disclaimer – Financial and Legal Information: The analyses, commentary, and content published on eco3min.fr are provided for informational and educational purposes only. They do not constitute investment advice or a solicitation to buy or sell financial instruments. Past performance is not indicative of future results. All investment decisions involve risk and are the sole responsibility of the reader. Data, charts and calculated series are provided as is and may contain errors or lag behind their source: check any figure against the primary source cited before relying on it. Content describing laws, regulations or contracts reflects the law as of its publication date and does not constitute legal or tax advice; applying it to a specific situation requires a qualified legal or tax professional.