
Is Silver an Inflation Hedge or a Cyclical Industrial Input?

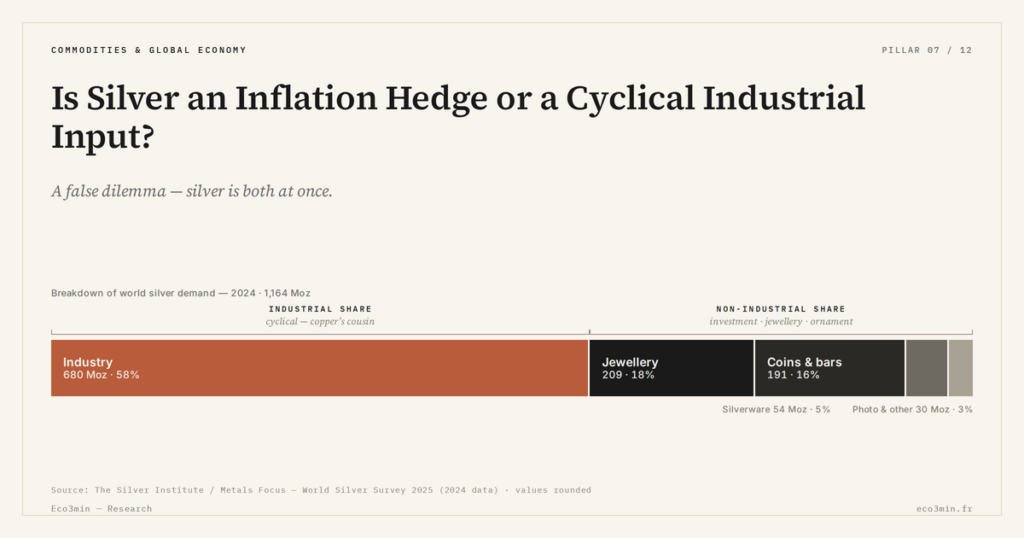
Silver is torn between two identities: a monetary metal, gold’s sibling, and an industrial commodity, copper’s cousin. This duality is why it behaves sometimes as a haven, sometimes as a cyclical asset — depending on the macro regime.
TL;DR
Silver hedges inflation with a lag and with leverage: it moves after gold sets the direction, then overshoots both ways, so a single strong decade overstates its reliability.
- From December 1969 to December 1979 silver climbed from about $1.83 to $30.13 an ounce, near 32% a year and more than gold, while US inflation peaked at 13.5% in 1980; the January 1980 spike toward $50 owed more to the market's cornering than to inflation.
- On 1791-to-2010 data, Bampinas and Panagiotidis rate gold the better long-run hedge, with silver standing out mainly in high-inflation regimes; in a deflationary panic its industrial half can drag it down even as gold holds.
Choosing between “inflation hedge” and “industrial input” is a false dilemma: silver is both at once, and context decides which one prevails. The twin satellite of this question: the limits of the GameStop playbook applied to silver.
1. Two metals in one: silver’s dual identity
No other asset combines two opposing natures so clearly. On one side, silver is a monetary metal: like gold, it served as money for millennia, it is hoarded as coins and bars, and its price reacts to currency weakness and real interest rates. This is the “haven” pole, the one that links it to gold and to distrust of paper money. On the other side, silver is a fully industrial commodity: close to half its demand comes from industry, tying it to global growth and the business cycle, much like copper. Grasping the industrial half of silver demand is therefore the starting point of any honest analysis of the metal.
This duality is no theoretical detail: it shapes the price’s daily behaviour. When the market fears monetary debasement, silver rises with gold; when it anticipates faster activity, it rises with the industrial metals. The two engines can pull in the same direction and amplify the move, or work against each other and blur it. It is precisely this overlap that sets silver apart from copper, a pure cyclical asset, and from gold, a pure monetary one. To locate these two poles, it helps to look at silver against cyclical copper, which embodies the industrial end of the spectrum.
From this dual nature flows a well-known property: silver is markedly more volatile than gold. Its market is narrower, and it faces two sources of uncertainty instead of one — monetary expectations and the industrial cycle. When the two poles align, the moves are spectacular, up and down alike. It is this amplitude that what the gold/silver ratio reveals measures in negative: the valuation gap between the two metals widens and narrows as one engine or the other takes the lead.
The monetary pole deserves a closer look. Like gold, silver pays no income: holding it carries an opportunity cost that depends on real interest rates. When those rates turn negative or very low, the appeal of precious metals rises, for lack of a competing yield; when they climb back, the argument weakens. Empirical studies indeed confirm a negative effect of rate moves on silver’s price, a sign that its monetary component obeys the same drivers as gold. But silver adds to this monetary sensitivity an exposure to the real cycle that gold lacks, and it is this industrial graft that makes its behaviour harder to anticipate.
2. An inflation hedge: a nuanced empirical record
The question “does silver protect against inflation?” allows no binary answer. The academic work converges on one point: over very long horizons, gold maintains a sturdier correlation with the price index than silver. The study by Bampinas and Panagiotidis, covering data from 1791 to 2010, concludes that gold is the better long-term inflation hedge, but that silver stands out particularly in high-inflation regimes. Over short horizons, by contrast, the link between silver and the price index is erratic and hard to quantify — a finding that echoes gold as an inflation hedge and its own empirical limits.
The reference episode remains the stagflation of the 1970s. From December 1969 to December 1979, silver’s price rose from about $1.83 to $30.13 an ounce, a compound annual rate of roughly 32%, higher than gold’s over the same decade, while US inflation peaked at 13.5% in 1980. On that particular case, silver did play — and even overplay — the role of a hedge. But this record demands a caveat: the January 1980 peak, when the ounce briefly approached $50, owed much to the 1980 cornering of the market, not to inflation alone. Conflating the two leads to overstating the metal’s reliability as protection.
The transmission mechanism explains these results. Silver benefits from inflation through two distinct channels. The first is indirect: it follows gold, whose correlation with inflation is stronger; silver thus profits “at one remove” from haven demand. The second is direct: when rising prices accompany an overheating economy, industrial demand for silver tightens just as prices climb. When the two channels work together — inflation and vigorous growth — silver can outperform. But when inflation arises from a supply shock that simultaneously chokes industry, the industrial pole becomes a handicap at the very moment the monetary pole would want to act. The hedge then turns partial, even ineffective.
More recent episodes confirm this ambivalence. During the 2008 financial crisis, then through the recovery that followed the 2020 pandemic, silver posted strong gains in the wake of monetary easing and demand for protection — illustrating its haven pole. But those same episodes also saw phases where fear of recession briefly broke the price, the industrial pole regaining the upper hand. Regime-switching models, applied to decades of data, reach a measured conclusion: silver offers protection complementary to gold, especially effective in the transition phases between cycles, but it is not as reliable or as stable a hedge as the yellow metal.
One nuance follows from the two-channel structure: silver tends to hedge inflation with a lag and with leverage rather than smoothly. Because it leans partly on gold, it often moves after the yellow metal has set the direction; and because its market is thinner, it tends to overshoot in both directions once it does move. The historical record reflects this — silver’s inflation-era gains have been larger than gold’s at their peak, but also more violently reversed. That asymmetry matters for how its behaviour is read: a metal that amplifies the cycle is not the same as one that smooths it, even when both are nominally labelled precious. The label conceals more than it reveals, and a single strong decade does not establish a stable rule.
3. Why the regime decides
The reading key is therefore not a fixed label but the dominant macro regime. In a reflation — growth and inflation together — silver’s two poles align and the metal tends to outperform gold: this is the terrain where its dual nature becomes an asset. In a stagflation, the result is ambiguous: the monetary pole supports the price, but the industrial pole suffers from the slowdown, and the outcome depends on the balance between the two. In a deflationary shock or a market panic, finally, silver proves a poor haven compared with gold: its industrial component drags it down at the worst moment, and empirical studies rate it a weak safe-haven. This is why the electronic and automotive outlet is inseparable from any monetary reading of the metal.
This regime dependence also explains a persistent misunderstanding. Silver is often presented as a cheap substitute for gold, supposed to offer the same protection at lower cost. Yet the two metals are not interchangeable: their behavioural gap widens precisely when the industrial cycle diverges from monetary expectations. To believe that silver as the poor man’s gold will mechanically reproduce gold’s defensive qualities is to ignore half its nature — the industrial half, which can penalise it just when protection is expected.
How, in practice, to tell which pole dominates at a given moment? The most direct gauge is the valuation gap between gold and silver. When the yellow metal clearly outperforms, it usually signals haven demand that silver struggles to follow, held back by its cyclical component; when silver catches up or overtakes gold, it often means the industrial engine or reflation is taking over. None of these moves has mechanical predictive value, but they offer a descriptive grid for the regime under way. That grid describes the past and the present, not the future: the same regime can produce different paths depending on where valuations start from, which is why no single reading of the ratio settles the question for good. It is in this permanent tension, more than in any fixed label, that the metal’s real identity resides.
At bottom, filing silver under a single heading amounts to amputating its identity. It is neither a discount gold nor a mere precious copper: it is a hybrid whose dominant pole shifts with conditions. This plasticity is its main analytical feature, and the reason its behaviour resists any one-line summary. Placing silver back within the regimes of physical resources shows that its value oscillates at the crossroads of money and industry, never quite belonging to either.
Silver is often seen as a “poor man’s gold” offering the same inflation protection at a lower price. That forgets its industrial half: in a deflationary panic, silver can fall even as gold holds, because its demand also depends on the business cycle. Its hedge is real, but conditional on the regime.
Last updated — 7 July 2026
Disclaimer – Financial Information: The analyses, commentary, and content published on eco3min.fr are provided for informational and educational purposes only. They do not constitute investment advice or a solicitation to buy or sell financial instruments. Past performance is not indicative of future results. All investment decisions involve risk and are the sole responsibility of the reader.
Read next
Full pillar →Reading the refinery utilisation rate: the threshold, the season, the turnarounds
A refinery runs full near ninety percent, not a hundred: the last slice of nameplate capacity is a…
IMO 2020: the regulatory shock that rewrote product spreads
An environmental rule on marine sulfur can move a refining spread more than a swing in crude. IMO…
The 2022–2023 refining golden age: anatomy of an episode
In 2022, refined fuel prices climbed faster than crude. That gap, measured by the 3-2-1 crack spread, reached…


