
Silver versus Copper: Two Industrial Metals, Two Macro Signals

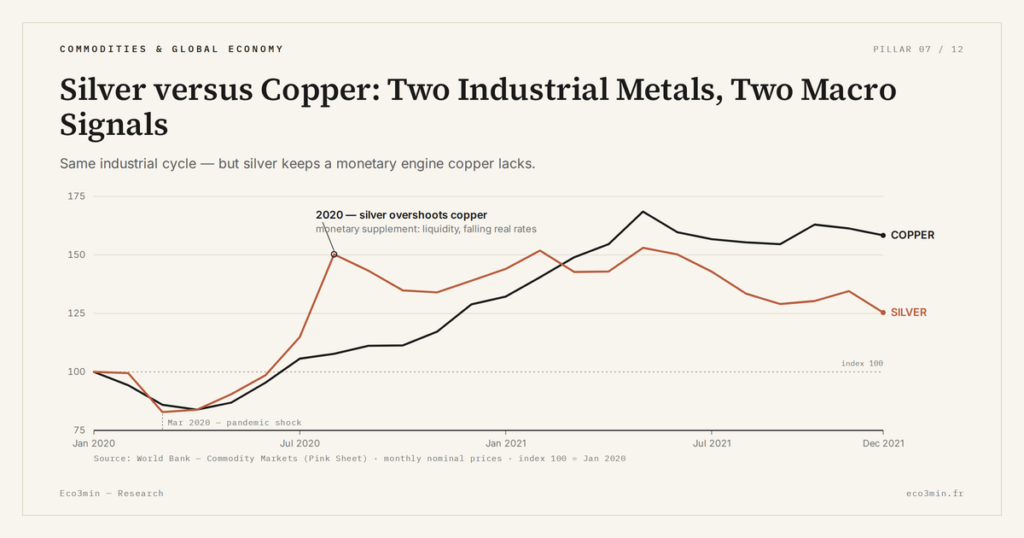
Silver and copper are two industrial conductors that the energy transition propels together. But one keeps a monetary dimension the other never had — and that difference is what separates their signals for anyone watching the macroeconomic cycle.
TL;DR
Mined mostly as a by-product and still bought as a safe haven, silver diverges from copper whenever monetary forces overtake factory demand, making the gap between them readable.
- Copper is mined in tens of millions of tonnes a year against a few tens of thousands for silver, hundreds of times larger by volume and far harder to move with financial flows.
- Silver's conductivity edge over copper is marginal while its cost is far higher, so engineers design it out when it spikes, as the gradual de-silvering of photovoltaic cells shows.
- Copper, nicknamed 'Dr. Copper', feeds the copper-gold ratio that gauges growth versus haven and often tracks bond yields, while the gold/silver ratio measures silver inside the precious-metals family.
Comparing the two metals, where they converge and where they diverge, helps read what each really says about the economy.
1. Two conductors, one industrial cycle
Silver and copper share a calling: to conduct electricity. Silver is the best known electrical and thermal conductor, but its price confines it to applications where performance is paramount; copper, more abundant and far cheaper, is the workhorse of global electrification. This functional kinship places them at the heart of the same end uses. Power grids, photovoltaics, electric vehicles and electronics draw on both metals, often in the same equipment. The pressure of silver’s solar demand thus has its counterpart on the copper side, where wiring and inverters drive parallel demand.
As a result, the two metals respond to the same cyclical engine. When global industry accelerates, demand for conductors rises, and silver and copper tend to climb together. Uses tied to electrification — silver in electronics and vehicles being one illustration — reinforce this correlation, since every electric vehicle, every charging point, every server consumes both copper and silver. On the industrial portion of their demand, the two metals therefore tell a common story: that of the pace of global manufacturing activity.
Their supply structures, however, present a notable asymmetry. Copper comes mostly from mines dedicated to it, whereas silver mined as a by-product of zinc, lead, copper and gold makes up the bulk of production. Silver supply therefore responds more weakly to its own price: it depends on the cycles of other metals. This rigidity heightens silver’s volatility and complicates direct comparison with a copper whose output responds, over a longer horizon, to its own incentives.
This proximity also feeds a quiet rivalry. Where the two metals can substitute for one another — typically in contacts and conductive pastes — price arbitrates: when silver grows too expensive, engineers seek to replace it with copper, as the gradual de-silvering of photovoltaic cells illustrates. This partial substitutability acts as a valve: it partly caps silver demand and ties its fate to the price gap with copper. The two metals are thus not only cycle companions but also marginal competitors in certain uses.
The spectrum of shared uses widens with digitalisation. Data centres, 5G networks, industrial automation: each wave of electronics pulls copper, for power and interconnection, and silver, for high-reliability contacts and solders, together. This commonality of outlets explains why the two metals appear side by side in baskets of “transition” commodities, and why their long-term demand trajectories point in the same direction, carried by electrification and decarbonisation.
Yet the kinship has limits even within industry. Silver’s edge in conductivity over copper is marginal, while its cost is vastly higher, so engineers reach for it only where reliability or miniaturisation justify the premium. This keeps silver’s industrial share concentrated in high-value niches and makes its demand more sensitive to substitution than copper’s. When silver spikes, the incentive to design it out strengthens; when it eases, it creeps back into specifications. Copper faces no such precious-metal premium pressure, which is one more reason its industrial demand reads as a cleaner cyclical signal.
2. Where they diverge: silver’s monetary dimension
The industrial kinship ends where silver’s monetary history begins. Copper is a purely industrial metal: no one holds it as a store of value, hoards it in investment bars, or flees to it in times of financial stress. Silver, by contrast, keeps a share of gold: investment demand, coins and bars, a diminished but real safe-haven role. This is the whole point of silver’s monetary dimension, absent from copper, which makes the latter a pure barometer of industry and the former a metal with a split personality.
The gap in scale further sharpens the divergence. The copper market is counted in tens of millions of tonnes mined each year, against a few tens of thousands of tonnes for silver: by volume, copper is hundreds of times larger. This size makes copper a deep market, hard to move with financial flows, whereas silver, narrower, reacts with amplitude to both industrial shocks and investment flows. The same rise in industrial demand therefore translates into very different amplitudes across the two metals.
This asymmetry has historical roots. Silver was money for millennia, and its monetary past continues to colour how investors perceive it, long after its demonetisation. Copper, by contrast, was only ever occasionally monetary — a few low-value coins — and never attained the status of a store of value. This heritage, not a physical property, explains why one attracts investment and hedging flows while the other attracts only industrial buyers and a few operators playing the cycle.
That is also why the gold/silver ratio exists, with no universally followed equivalent for copper. Following reading the gold/silver ratio means measuring silver against gold, that is, within the precious-metals family — a frame that makes no sense for copper. Copper is more readily measured against gold in another form: not as a precious metal, but as a gauge of growth versus haven.
3. Two different signals for the macro observer
From these distinct natures flow distinct signals. Copper, nicknamed “Dr. Copper” for its reputation of anticipating economic turning points, is a relatively pure barometer of the global industrial cycle: its demand being almost entirely real, its price reflects fairly faithfully the state of manufacturing and construction. When set against gold, the copper-gold ratio becomes an indicator of the trade-off between growth and haven, one that often tracks the movement of bond yields. Reading the copper-gold ratio signal means questioning the market’s confidence in growth.
Silver sends a more ambiguous message, because it superimposes two sources. A rise in silver can signal an industrial acceleration — like copper — or a flight to safe havens in times of monetary stress — like gold. Taken alone, its price is therefore a noisy signal: it amplifies both the real cycle and monetary strains, without saying which dominates. That is precisely why silver gains from being read alongside copper and gold: if silver and copper rise together, the engine is probably industrial; if silver follows gold while copper weakens, the engine is rather monetary or defensive.
The 2020 episode illustrates this reading grid. At the height of the pandemic shock, both metals first fell; then copper rebounded with the pace of the manufacturing recovery, signalling a growth that was healing. Silver, for its part, outperformed copper in the next phase, boosted not only by the industrial recovery but also by the flood of liquidity and the fall in real rates — a monetary supplement copper does not enjoy. The divergence between the two then signalled, better than either taken alone, the respective share of the real and the monetary in the rebound.
This is not a one-off pattern. Across cycles, the relationship between the two metals tightens in industrial booms and loosens when monetary forces — inflation fears, rate shifts, haven flows — assert themselves over the growth story. A widening gap between a rising silver and a lagging copper is, in itself, information: it suggests the move is being driven by something other than factory demand. The frontier between the two metals is, in that sense, less a wall than a diagnostic tool, one that tells the observer which kind of force is currently in charge.
This complementarity has a practical reach. An observer following only copper would faithfully capture the industrial cycle, but would miss the phases where monetary stress takes over. An observer following only silver would confuse a real recovery with a flight to safety. It is by holding both threads — the purely industrial barometer and the dual-engine metal — that one distinguishes what, in a price move, belongs to the real economy and what belongs to the financial sphere. Resituating this comparison within the world of physical commodities is a reminder that no metal is read in isolation: it is the joint reading that turns prices into signals. It is less one against the other than one with the other, and with gold as a third term, that silver and copper take on their full meaning for the macro observer. Read together, they map not just where the economy is heading, but what is pushing it there.
- Silver and copper are two industrial conductors driven by the same cycle (electrification, photovoltaics, electric vehicles) and tend to rise together in expansion phases.
- Copper is a market hundreds of times larger by volume and purely industrial; silver, narrower, keeps a monetary dimension and a safe-haven demand.
- Copper is a relatively pure growth signal (“Dr. Copper”); the copper-gold ratio gauges the growth-versus-haven trade-off and often tracks bond yields.
- Silver’s price is a noisy signal because it blends an industrial and a monetary engine; it becomes legible once read alongside gold and copper.
Last updated — 27 June 2026
Disclaimer – Financial Information: The analyses, commentary, and content published on eco3min.fr are provided for informational and educational purposes only. They do not constitute investment advice or a solicitation to buy or sell financial instruments. Past performance is not indicative of future results. All investment decisions involve risk and are the sole responsibility of the reader.
Read next
Full pillar →Reading the refinery utilisation rate: the threshold, the season, the turnarounds
A refinery runs full near ninety percent, not a hundred: the last slice of nameplate capacity is a…
IMO 2020: the regulatory shock that rewrote product spreads
An environmental rule on marine sulfur can move a refining spread more than a swing in crude. IMO…
The 2022–2023 refining golden age: anatomy of an episode
In 2022, refined fuel prices climbed faster than crude. That gap, measured by the 3-2-1 crack spread, reached…


