
Where Does Silver Demand Go? Industry, Jewellery and Investment, Broken Down

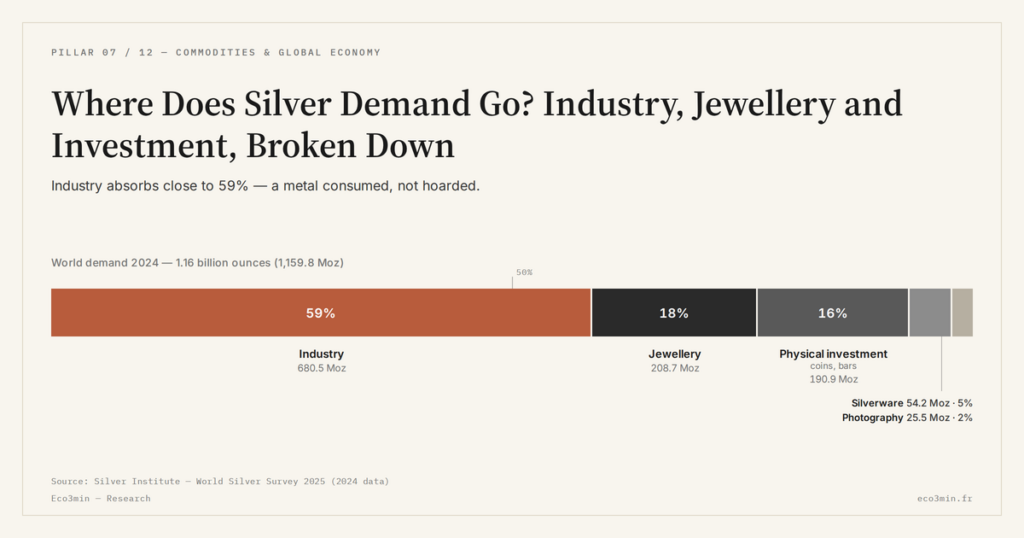
Silver demand splits across three worlds with opposing logics: an industry that consumes and dissipates it, investors who hoard it, and traditional uses in slow retreat. In 2024, industry absorbed close to 60% of the total.
TL;DR
Because most silver is transformed rather than held, industry's near-60% share gives the metal a structural floor of demand that hoarded gold does not have.
- Industrial demand set a fourth straight record at 680.5 Moz (close to 59% of the 1.16 billion-ounce total), driven by structural megatrends in solar, transport electrification and electronics rather than a single business cycle.
- The market has run a deficit for five straight years, 148.9 Moz in 2024; a gap driven by steady industrial pull behaves differently from one driven by a swing in investment flows.
Breaking demand down end use by end use reveals why silver answers not to a single price driver, but to several desynchronised clocks.
1. Industrial demand, now the majority
Total global silver demand stood at roughly 1.16 billion ounces in 2024, according to the Silver Institute’s World Silver Survey 2025 — down 3% on the year and below the record of 1.28 billion set in 2022. Within that total, one block now dominates all others: industrial demand, which reached a record 680.5 million ounces, up 4%, accounting for close to 59% of global consumption. This is the share that sets silver apart among so-called precious assets: most of the metal is not held, it is transformed.
This industrial demand is not monolithic. Its largest segment by volume is electronics and electrical engineering, which also set a record in 2024, carried by silver’s unmatched conductivity. Next comes photovoltaics, whose consumption reached about 198 million ounces — close to 29% of industrial demand — followed by automotive applications, brazing and soldering, and more specialised uses such as the catalysts that produce ethylene oxide. Each of these segments follows its own cycle: silver’s role in electronics answers to waves of equipment and corporate technology spending, while solar demand in detail depends on the pace of capacity installation, itself driven by energy policy.
The common thread across these industrial uses is that they dissipate the metal. Silver laid down in a solar cell or a printed circuit is used in quantities so small that it is, most often, never recovered: it leaves the market. This irreversible consumption sharply distinguishes silver from gold, whose mined tonnage over millennia stays almost entirely available. It is also why an imbalance between supply and demand weighs quickly on price: in 2024 the market recorded a physical deficit of 148.9 million ounces, the fifth consecutive year of imbalance, which neither mine production, near 820 million ounces, nor recycling managed to close. This majority industrial component is precisely what pulls silver away from a purely monetary register and complicates what the gold/silver ratio measures.
The rise in industrial demand rests not on a single use but on the sum of several structural trends pushing the same way. That is why this segment has set a fresh record four years running: to the growth of solar and electronics are added quieter but real uses — brazing and soldering, electrical contacts, antimicrobial treatments, ethylene-oxide chemistry. This diversity lends industrial demand a degree of resilience, since a slowdown in one segment can be offset by strength in another. It also makes the whole sensitive to the global manufacturing cycle and to corporate investment — two variables that have nothing to do with the monetary drivers of gold’s price. The nature of demand shapes the nature of the price.
What makes this industrial pull unusual is that its drivers are structural rather than cyclical. Several long-running megatrends — the build-out of solar capacity, the electrification of transport, the spread of advanced electronics and computing — pull in the same direction at once, rather than rising and falling with a single business cycle. That convergence is why industrial demand has set records even in years when investment and traditional uses softened. It does not make the segment immune to a downturn: a sharp global slowdown would still curb factory orders. But it gives silver a floor of demand anchored in physical transformation, a floor that gold, held rather than consumed, simply does not have.
2. Investment demand: coins, bars and exchange-traded products
The second great leg of demand is investment, and it carries silver’s residual “monetary” share. It runs through two distinct channels that must be separated to avoid misreading the picture. The first is direct physical investment — coins and bars — which fell sharply in 2024, by 22%, to 190.9 million ounces, a five-year low. That decline, concentrated in Western markets where holders took profits, was partly offset by India, up 21%. The second channel is metal-backed exchange-traded products, ETPs, which by contrast saw net inflows of about 61.6 million ounces over the year, as financial uncertainty drew investors back toward the metal.
This divergence between coins and listed funds is not incidental: it sets two populations of investors against each other, one attached to physical holding, the other favouring the liquidity of a market product. The differences in price, fees and exposure between these vehicles are examined separately, in a study that details the differences between physical silver and ETFs. As for the motives that push toward silver in times of stress, they belong to the debate over its protective status, treated on its own: the question of silver as an inflation hedge largely governs the vigour of this segment from one year to the next.
The defining feature of investment demand is its volatility. It is the segment that swings most strongly year to year, able to collapse then rebound with the macro climate, where industrial demand advances more steadily. That instability explains why a minority of total demand can nonetheless move the price disproportionately during episodes of monetary stress: when risk aversion rises, investment flows reverse quickly, while factories keep consuming at the same pace. Its geography is shifting, too. The 2024 retreat in coins and bars was largely Western, as long-standing holders rotated toward profit-taking after the price rise, while Indian demand advanced on a deeply rooted culture of metal saving. For 2025, the Silver Institute anticipated a recovery in flows into listed products, which it tied to expected cuts in US policy rates, worries over public debt and geopolitical tension. This segment remains the most sensitive barometer of the monetary climate.
3. Jewellery, silverware and photography: the traditional uses
The remainder of demand splits across historical uses whose paths diverge. Jewellery rose slightly in 2024, by about 3%, supported notably by Asian demand, while silverware fell about 2%, extending a structural erosion of precious-metal tableware. Photography, once a major outlet, represented only about 25.5 million ounces, down 7%, a relic of a use largely supplanted by digital. Together these segments now weigh far less than industry and investment, but they round out the picture of a metal with exceptionally varied uses.
Behind these aggregate figures lie contrasting regional and technical dynamics. Silver jewellery remains carried by Asian markets, India in particular, where the metal serves both as ornament and as an accessible store of savings — much like gold, but at a far lower unit price. Photography now survives only in niches — medical film, industrial applications and long-term archiving — that resist digitisation through their reliability requirements. Recycling, for its part, climbed to a twelve-year high of 193.9 million ounces in 2024; part of the flow comes from processing spent industrial catalysts, part from melting old jewellery and silverware, encouraged by higher prices and cost-of-living pressures. This secondary flow adds to mine output on the supply side but still falls short of balancing a market in deficit, since the bulk of silver’s by-product mine supply barely responds to the silver price.
Read against supply, the decomposition takes on its full meaning. A demand of 1.16 billion ounces met a total supply a little above one billion, leaving the 148.9-million-ounce gap the market has now run for five straight years. Crucially, the composition of that demand shapes how the gap behaves: the industrial core grows steadily and is hard to defer, while the investment slice can swing violently with sentiment. A deficit driven by relentless industrial pull is a different animal from one driven by a burst of speculative buying, even when the headline number looks the same. Knowing where the demand comes from is therefore the first step to reading what any imbalance actually means.
Compared with gold’s, this split throws silver’s singularity into relief. Where gold demand is dominated by hoarding — central banks, funds, savings jewellery — silver’s now leans clearly toward industrial consumption. Setting the composition of gold demand alongside it lights this contrast, which sits more broadly within the geoeconomics of resources. It is this demand structure, not a single narrative, that determines how silver’s price is formed.
- Total silver demand stood near 1.16 billion ounces in 2024 (Silver Institute), split across industry, investment and traditional uses.
- Industry absorbs close to 59% (680.5 Moz, a record), with electronics the largest segment and solar at about 198 Moz.
- Investment runs through two opposing channels: coins and bars, down 22% to 190.9 Moz, and ETPs, with net inflows of about 61.6 Moz — the most volatile segment.
- Jewellery (+3%), silverware (−2%) and photography (25.5 Moz, −7%) round out a demand whose mostly industrial nature sets silver apart from gold.
Last updated — 9 July 2026
Disclaimer – Financial Information: The analyses, commentary, and content published on eco3min.fr are provided for informational and educational purposes only. They do not constitute investment advice or a solicitation to buy or sell financial instruments. Past performance is not indicative of future results. All investment decisions involve risk and are the sole responsibility of the reader.
Read next
Full pillar →Reading the refinery utilisation rate: the threshold, the season, the turnarounds
A refinery runs full near ninety percent, not a hundred: the last slice of nameplate capacity is a…
IMO 2020: the regulatory shock that rewrote product spreads
An environmental rule on marine sulfur can move a refining spread more than a swing in crude. IMO…
The 2022–2023 refining golden age: anatomy of an episode
In 2022, refined fuel prices climbed faster than crude. That gap, measured by the 3-2-1 crack spread, reached…


