
How Much Silver Is in a Solar Panel? Photovoltaics as a Structural Demand Driver

Every solar panel holds around twenty grams of silver, laid down as a conductive paste. Multiplied by the hundreds of gigawatts installed each year, that thread of metal has made photovoltaics one of silver’s leading industrial outlets — yet a technology race keeps its appetite in check.
TL;DR
China hosts most of the world's cell and module making, so its choice of cell architecture and how hard it thrifts largely sets the global silver-demand curve.
- Silver paste can run close to a tenth of a module's total cost, its largest non-silicon item, which makes thrifting a permanent feature of module economics rather than an occasional tweak.
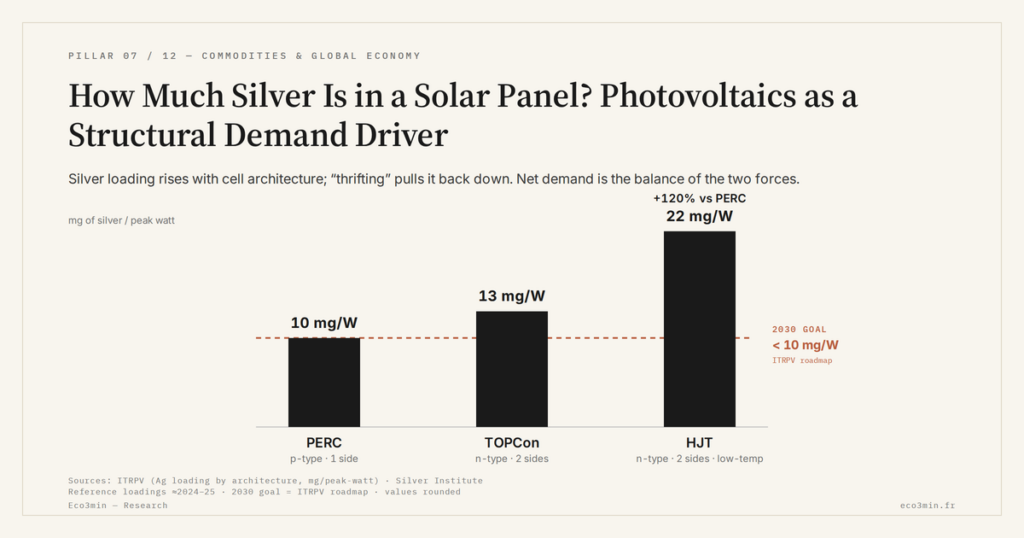
- Loading rises with cell architecture: about 10 mg of silver per watt for PERC, 13 mg for TOPCon, and close to 22 mg for heterojunction (HJT), roughly 120% above PERC.
- Copper metallisation, via electroplating or silver-coated copper pastes, can cut silver content by more than half, making the silver-versus-copper trade-off largely economic as silver trades at tens of dollars an ounce.
Understanding silver’s role in the solar cell is to grasp why this demand is at once structurally biased upward and bounded by engineering.
1. Why silver is indispensable to the solar cell
A solar cell produces nothing useful unless the current it generates can be collected efficiently. That is the job of metallisation: a network of fine conductive lines, screen-printed onto the silicon surface, that capture electrons and carry them to the panel’s terminals. For this role silver is the natural choice, because it is the best electrical conductor known and resists oxidation. Silver paste forms the “fingers” and “busbars” of the front-side grid, where the slightest parasitic resistance turns into lost efficiency. No common material matches its performance without compromising the module’s reliability or lifespan.
The quantities involved look trivial at the scale of a single panel: on the order of twenty grams of silver per module, about 6% of manufacturing cost. But the industry thinks in grams per watt, and it is at the scale of global production that the sum becomes considerable. By market estimates, it takes roughly ten tonnes of silver for every gigawatt of panels manufactured; set against an annual output now counted in hundreds of gigawatts, photovoltaics absorbed about 198 million ounces of silver in 2024, according to the Silver Institute. This place within the breakdown of silver demand is no footnote: solar now represents close to 29% of industrial demand, against roughly 11% a decade earlier.
Solar silver shares a decisive trait with other technology uses: it is dissipated. Once embedded in the panel and sealed for twenty-five to thirty years, the metal is barely recovered before the module reaches end of life, and mass recycling remains embryonic. This near-irreversible consumption sharply separates solar from the hoarding that dominates gold, and aligns it with silver in electronics and electric vehicles, likewise pulled by equipment rather than by savings. It is this consuming nature that anchors a growing share of silver’s price in the real economy.
This dependence is not a legacy that could be erased at will. Attempts to replace silver with cheaper metals run into a wall of reliability: silver-free cells tend, at comparable efficiency, to show lower output and shorter lifespans — a crippling handicap for equipment sold on a multi-decade performance warranty. It is this technical difficulty, as much as the metal’s raw conductivity, that explains silver’s persistence in the panel’s bill of materials despite its cost. Solar is thus a textbook case of captive demand: indispensable for physical reasons, but under constant optimisation pressure because of its price. Optimisation pressure of that kind travels straight into the cost-per-megawatt-hour measure behind solar’s headline competitiveness.
That cost pressure is far from marginal. Silver paste can account for close to a tenth of a module’s total cost, making it one of the largest non-silicon items in the bill of materials and a natural target for engineers chasing cheaper panels. Every cent per watt shaved from the metal bill compounds across terawatts of production. This is why silver thrifting is not an occasional optimisation but a permanent feature of the industry’s economics: the same metal that makes the cell work also eats into the razor-thin margins of module makers. The tension between performance and cost is, in a sense, built into every cell that leaves the line.
2. The race between cell architecture and thrifting
The path of solar demand is not just the growth of installations. It results from a clash between two opposing forces, and that is what makes it hard to project. On one side, the silver content per watt depends on cell technology, and technology is moving toward hungrier architectures. The 2010s standard, the PERC cell, consumed about 10 milligrams of silver per watt. Its successor, the TOPCon cell, needs more, on the order of 13 milligrams; and heterojunction technology, or HJT — the most efficient but also the most demanding — can require close to 22 milligrams per watt, an increase of around 120% over PERC, owing notably to paste applied on both faces and the need for low-temperature firing. The shift to N-type cells therefore mechanically pulls the loading upward.
On the other side works “thrifting”: manufacturers’ constant effort to cut the silver per cell. Industry roadmaps, Chinese ones in particular, target ever-finer lines — below twenty micrometres wide — and more frugal paste formulations, with content cuts on the order of 2 to 3% per year and a goal driven below 10 milligrams per watt by 2030. In practice, the loading of TOPCon cells has already eased year over year as processes matured. Net solar silver demand is therefore the balance of two movements: rising installed volumes and the drift toward hungrier cells on one hand; falling material intensity through optimisation on the other. It is precisely this ambivalence that makes photovoltaics a real but unpredictable engine for silver’s dual monetary and industrial nature.
This mechanic carries an often-overlooked consequence: solar silver demand can grow even as the industry actively seeks to do without it. So long as thrifting lags the architecture change, the average loading per watt can even tick back up temporarily. Conversely, a breakthrough in paste reduction or a slowdown in installations would loosen the market. The trajectory is therefore never a straight line, and any reading that mechanically extrapolates past growth makes a reasoning error.
Solar is often presented as the assurance of ever-rising silver demand, even of a price melt-up. That ignores thrifting and copper substitution, which can cap the loading per watt. Solar demand is structurally biased upward, but its scale depends on a technology race whose outcome is unwritten.
3. De-silvering and the 2030 stake
The long-run threat hanging over solar silver demand has a name: de-silvering. When silver’s price climbs, the incentive to replace it strengthens, and technical solutions exist. The main one is copper metallisation, by electroplating or via silver-coated copper pastes, which can cut silver content by more than half. Some heterojunction lines already use low-temperature silver-coated copper pastes that markedly reduce consumption. The trade-off is first economic: with silver at several tens of dollars an ounce against copper at a few dollars a pound, substitution becomes financially attractive as soon as it is technically mastered. This is one of the arenas where the rivalry between silver and copper plays out, two metals the energy transition sets in direct competition.
The other side of the equation is the supply constraint. Silver mine production responds slowly, and opening a new primary deposit takes several years — often five to seven — between decision and first pour. This inertia creates a window of tension: if solar demand accelerates faster than supply can follow, the imbalance resolves through price, which in turn strengthens the incentive to de-silver. Solar demand is thus caught between a mine supply slow to respond and its own capacity to substitute. This balancing act places the metal at the heart of the trade-offs of the physical economy of resources.
The concentration of capacity gives these dynamics a single centre of gravity. China hosts the bulk of the world’s cell and module manufacturing — hundreds of gigawatts of TOPCon capacity and a fast-growing heterojunction base — so the pace at which Chinese producers adopt one architecture over another, and how aggressively they thrift, largely sets the global silver demand curve. A handful of corporate roadmaps and a single country’s industrial policy thus ripple through a market priced in London and New York. Few commodities are so exposed to the technology choices of one industry in one place.
By 2030, the scale of the stake comes into focus. Several academic studies estimate that photovoltaics could absorb around 40% of global silver demand by then, as manufacturing capacity moves from half a terawatt a year toward a terawatt and beyond, and as the mix shifts to hungrier cells. The numbers sharpen the tension: some analyses anticipate total silver demand on the order of 48,000 to 52,000 tonnes a year by 2030, against supply that would stay near 34,000 tonnes on its historical trend — a gap only price could close — with the photovoltaic share growing by a factor of 1.6 to 2.3. This trajectory mirrors copper’s, whose own structural pull copper and the electrification wave illustrates. The geographic concentration sharpens it further: China dominates cell and module manufacturing, so its technology and industrial choices weigh heavily on global silver demand. The net result will depend on the relative speed of three races — installation, thrifting and de-silvering — none of them certain. Solar will remain a leading demand engine; whether it still draws as much silver per gigawatt as today is the open question.
Last updated — 22 July 2026
Disclaimer – Financial Information: The analyses, commentary, and content published on eco3min.fr are provided for informational and educational purposes only. They do not constitute investment advice or a solicitation to buy or sell financial instruments. Past performance is not indicative of future results. All investment decisions involve risk and are the sole responsibility of the reader.
Read next
Full pillar →Reading the refinery utilisation rate: the threshold, the season, the turnarounds
A refinery runs full near ninety percent, not a hundred: the last slice of nameplate capacity is a…
IMO 2020: the regulatory shock that rewrote product spreads
An environmental rule on marine sulfur can move a refining spread more than a swing in crude. IMO…
The 2022–2023 refining golden age: anatomy of an episode
In 2022, refined fuel prices climbed faster than crude. That gap, measured by the 3-2-1 crack spread, reached…


