
Copper Price: A Quiet Signal for Global Reindustrialization
Copper prices have become a leading indicator of global reindustrialization and capex cycles, more than a simple proxy for China. How to read the metal without misinterpretation.

The price of copper is becoming a key barometer of industrial investment and global reindustrialization. How to read it without misinterpretation.
TL;DR
Copper is becoming a barometer of industrial investment and reindustrialization, sending more nuanced signals than the headline equity indices. This specific point is developed further in the strategic dimension of commodity cycles.
- Prices went from $9,000–9,800 per tonne in the first half of 2025 to a record $11,800 in December 2025, above the spring 2024 peak ($10,100 in May), then $14,300 in August 2026 (IMF monthly averages, via FRED).
- Consensus focuses on low-carbon energy demand; the more discreet driver is reindustrialization and the relocation of value chains.
- Copper now behaves as a leading indicator of productive investment, more sensitive to credit and capex cycles than to growth narratives alone.
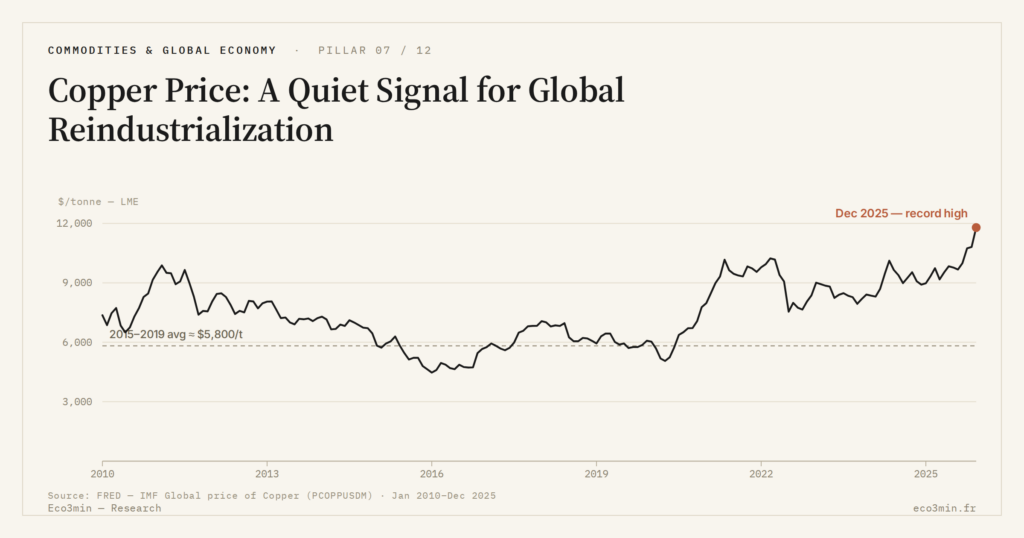
Since early December 2025, copper prices have held in an intermediate zone: neither recessionary collapse nor speculative surge. The topic is treated more broadly in how cyclical and structural forces shape copper demand. This apparent stability masks contradictory tensions: normalizing Chinese demand, US infrastructure programs, discreet European reindustrialization, and persistent supply constraints in several producing countries. The deindustrialization phase that preceded it is set out in Europe’s gas-cost competitiveness fracture. A companion piece: silver read against copper.
What is changing without fanfare is copper’s role as a leading indicator of real reindustrialization rather than a simple barometer of China. For a reader already tracking commodities in the global economy, the red metal now sends more nuanced signals than the major equity indices.
To place copper in the broader macro framework — monetary policy, real rates, business cycle — the cycle reading framework via the yield curve remains the reference compass.
Trigger fact: surprisingly calm copper despite tensions
In November 2025, copper traded at an average $10,800/tonne (IMF, via FRED), above the $7,900 trough of October 2023 and the 2021–2022 high ($10,200 monthly average in March 2022); December 2025 printed a record $11,800. At the same time:
- real policy rates remain slightly positive in most advanced economies since mid-2024,
- global growth is estimated at 3.2% for 2025 by the IMF (World Economic Outlook, October 2025),
- industrial investment indices (capex) have been timidly recovering since Q2 2025 in the United States and Japan, but remain hesitant in the euro area.
Spot prices therefore do not tell a boom-or-bust story. They suggest rather a transition phase: the market is testing a new equilibrium between a classic late-stage industrial cycle and a more structural wave of investment tied to the reorganization of value chains.
Many dominant projections explain this level by a simple “cooling” of Chinese demand. The angle worth isolating today is different: how copper does, or does not, reflect reindustrialization in North America and Europe, and the repositioning of productive capital.
Economic mechanics behind the copper price
A cyclical asset… but not only
Historically, copper is considered one of the best barometers of industrial activity: when durable goods production, construction and infrastructure investment accelerate, copper demand follows. Over 2000–2019, several marked upward phases for the metal coincided with accelerations in global investment, particularly in China. A complementary angle appears in the copper-gold pair read as a cycle barometer.
Since 2020, the mechanics have grown more complex:
- Post-pandemic stimulus plans (2020–2021) caused a temporary overheating, with copper above $10,000/tonne in spring 2021.
- The rapid monetary tightening from 2022 raised the cost of capital, gradually reducing new mining and industrial projects.
- Geopolitical tensions (Middle East, Red Sea, China/West rivalries) increased logistics costs and uncertainty around trade flows.
Result: copper now responds to a combination of macro factors (rates, growth, dollar), micro factors (mining capex, energy costs, strikes) and geopolitics. The mistake would be to read it as a simple thermometer of China.
This complexification of the price signal fits more broadly into the logic of real commodity cycles and their macroeconomic transmission, where copper no longer reflects only the immediate industrial cycle, but also long-term trade-offs between productive investment, the cost of capital and supply constraints.
Role of rates and the dollar on the value chain
Two monetary parameters structure the market:
- Real interest rates: since mid-2023, slightly positive real rates in several advanced economies have raised the financing cost of new mining and industrial projects. This brakes:
- capacity expansions among major miners,
- processing plant projects (refining, wiring, electrical components).
- Strong or stable dollar: between 2022 and 2025, the dollar remained globally elevated relative to the 2010s decade, mechanically raising the price of copper for non-US buyers and weighing on marginal demand.
In this context, a copper price holding in an elevated zone relative to the 2015–2019 average (often between $4,500 and $6,000/tonne) signals robust underlying demand, despite a more constrained credit environment. This suggests that reindustrialization and infrastructure programs are not just political rhetoric.
Reindustrialization: what copper actually measures
From political narrative to concrete capex
Since 2022, announcements have multiplied: subsidies for battery factories, incentives for the relocation of industrial segments, support laws for energy and digital infrastructure. Part of the market consensus remains cautious and views these plans as slow to materialize.
Yet several elements suggest copper is already capturing a deeper reality:
- Orders for electrical equipment, transformers and high-voltage cables have recovered in sector statistics between 2023 and 2025.
- Network expansion projects (transport electrification, data centers, urban grid reinforcement) consume large quantities of copper through multi-year contracts weakly correlated with quarterly cycles.
- Direct investment flows into “alternative” producing countries to the China bloc (Latin America excluding China, southern Africa) have been gradually progressing since 2022.
The market focuses on volumes imported by China, but the more discreet dynamic of electrical investments in North America, Europe and Asia ex-China contributes to underlying demand support.
What many readers are really looking for here is whether the current copper price level signals a new productive investment cycle or simple resistance ahead of a slowdown. The answer largely depends on the trajectory of real rates and the ability of states to maintain investment plans despite budgetary pressure.
Two technical indicators deserve particular attention:
- Warehouse inventory levels: since summer 2024, visible stocks in major exchange warehouses remain relatively low compared with the 2015–2019 average, despite a less euphoric macro context. This suggests industrial actors avoid letting too much working capital sit idle, but there is no massive oversupply either.
- Curve structure (contango/backwardation): periods when spot prices clearly outperform forward contracts reflect immediate tensions on physical availability. In 2025, the curve alternates between mild contango and near-flat phases, indicating a tight market but not a rupture.
For a reader, a useful KPI to track is the spread between spot and 3- or 6-month copper contracts. When this gap widens in favor of spot with low inventories, it signals an increased risk of short-term physical supply tensions, often linked to industrial projects ramping up.
What the market is imperfectly pricing
Part of the consensus rather anticipates a soft normalization of copper prices, justified by:
- a gradual slowdown in China,
- partial substitutions toward aluminum in some uses,
- medium-term supply acceleration thanks to new mining projects.
The analysis presented here diverges on a key point: the structural slowness of supply against diffuse but persistent demand tied to electrical networks, power electronics and industrial reorganization projects.
Two specific mechanisms work against a rapid price decline:
- Production lead times: between exploration, impact studies, financing, permitting and construction, a new mining project can require 7 to 10 years. Frozen or delayed decisions during the 2015–2019 period (lower prices, shareholder pressure on costs) are now paid for through less flexible supply.
- Environmental and social constraints: more and more jurisdictions require high standards on water, biodiversity and working conditions. This raises costs and can delay some projects, especially in countries where social acceptability is low.
This does not mean copper will necessarily surge, but the probability of a durably higher price regime than in 2010–2019 is under-integrated in many central scenarios.
What the reader really wants to know
Behind searches on the copper price lies a simple concern: arriving too late at a productive investment cycle change. The real question is not so much whether copper will rise or fall by $500/tonne, but whether its current behavior signals a durably different environment for industrial costs, manufacturer margins and infrastructure project valuations. Related discussion: iron ore as an alternative China barometer.
Put differently: should we expect copper to impose a higher cost floor on the real economy, or a return to the comfortable situation of the 2010s? Current data point rather to a world where the metal remains structurally more expensive, with jolts tied to the credit cycle.
Common reading mistakes on the copper price
- Reducing copper to “a China proxy”: this reading ignores the rise of capex linked to electrical networks and industrial relocation outside China. It is misleading because it leads to underestimating underlying demand in North America, Europe and several emerging economies.
- Confusing peak price with peak demand: a high-price episode, like 2021–2022, does not mean demand can no longer grow. It can simply reflect a brutal supply adjustment to a new consumption regime.
- Ignoring real rates: looking at the copper price without contextualizing it against real rates leads to overinterpreting moves. Stable prices with high real rates do not tell the same story as with very low real rates.
Three possible trajectories for the copper price
1. Controlled normalization scenario
Assumption: moderate slowdown in global growth in 2026, continued cautious rate cuts by major central banks, dollar still relatively firm. In this framework, copper would move in a ≈$7,500–9,000/tonne range, with jolts but no rupture.
This scenario rests on the assumption that reindustrialization programs advance but remain gradual, and that mining supply manages to follow, despite constraints.
2. Supply tension scenario
Assumption: a chain of disruptions (strikes, geotechnical issues, political instability in a major producing country) combined with stronger-than-expected acceleration of industrial and grid projects. Visible inventories would fall to historically low levels, the curve would shift into strong backwardation, and the price could revisit zones above $10,000/tonne.
This is not the central scenario today, but the market is not fully pricing in this possibility, given supply adjustment lags.
3. Demand shock scenario
Assumption: a sharper-than-expected global recession, linked for example to prolonged monetary tightening or a financial shock. Industrial investment would be cut, construction would brake markedly and several infrastructure projects would be deferred.
In this case, copper could return to a ≈$6,000–7,000/tonne zone, or temporarily below, with a contango curve and inventory build. This scenario would become more credible if industrial activity indicators and credit data deteriorated quickly in the coming quarters.
Update as of 22 September 2026: the path of scenario 2 is the one that materialised. The IMF monthly average (via FRED) went from $11,800 per tonne in December 2025 to $13,000 in January 2026 and $14,300 in August 2026, never falling back below $12,500; the $7,500–9,000 range of scenario 1 and the $6,000–7,000 zone of scenario 3 stayed unvisited over the period.
A cross-cutting risk to monitor: tighter-than-expected monetary policy if services or wage inflation re-accelerated. Sustainably higher real rates would weigh on capex and could break a bullish copper cycle even with supply constraints.
Practical benchmarks: leveraging this signal without overinterpreting it
Simple allocation and monitoring rule
Without entering personalized advice, a rule used by many actors consists in limiting direct or indirect exposure to cyclical commodities, including copper, to a modest fraction of an overall portfolio (for example a 5–15% range for all commodities, according to generic allocation frameworks).
In this framework, copper can be approached primarily as:
- an indicator of the industrial investment cycle,
- a cyclical diversification element,
- a cost factor to integrate into the analysis of copper-intensive companies (cables, electrical components, construction, industrial equipment).
For risk management, a simple approach involves articulating a triptych:
- a “core” sleeve exposed to the global economy,
- a more targeted sleeve on industrial / commodity themes,
- a sleeve of liquidity or defensive assets.
Indicators to track regularly
- Spot / 3-month spread: immediate supply tension (marked backwardation) or comfort (contango).
- Visible inventory level: persistent downward trend coupled with firm prices = risk of structural tension.
- Real rates of major central banks: gradual easing loosens financing for mining and industrial capex; an unexpected rise can break projects.
- Industrial investment indices: trends in capital goods orders, factory construction and infrastructure projects.
- Macro bulletins: to connect these signals to the global growth and inflation trajectory, regular analyses such as the weekly macroeconomic barometer help reposition copper in the general cycle.
Concrete implications for investors, companies and individuals
For investors
- Treat copper as a leading KPI of the investment cycle rather than a simple trading asset. Sustainably high prices with compressed inventories reinforce the assumption of a more capital-intensive world.
- Monitor implicit copper exposure via companies (builders, cable makers, electrical equipment) as much as via direct instruments.
- Articulate commodity exposure within a logic of satellite sleeve of limited size, complementary to a more diversified core sleeve.
For companies
- Integrate a scenario of durably higher copper prices into business plans, especially for sectors intensive in wiring, motors and industrial components.
- Review supply contracts (duration, price clauses, storage capacity) to reduce vulnerability to price spikes.
- Closely monitor changes in monetary policy and global capex, to anticipate demand cycle reversals.
For individuals
- View the copper price as a signal on the health of the productive economy: persistent rise with falling real rates = environment more favorable to industrial projects; sharp drop with rising rates = stress signal.
- Avoid building entire wealth decisions on a single commodity indicator: copper is useful, but must be weighed against rates, inflation, unemployment and capital flows.
- Use structuring analyses on financial markets as a basis for repositioning copper within the overall allocation rather than treating it in isolation.
In summary, the copper price is neither an infallible oracle nor mere market noise. It condenses part of the trade-offs between cost of capital, reindustrialization, environmental constraints and geopolitical tensions. Several trajectories remain possible, but the assumption of a higher price regime more sensitive to credit cycles deserves sustained attention.
The risk is less visible than others — equity volatility, bond shock — and therefore easier to ignore. Yet for those tracking the real economy closely, copper remains one of the rare indicators that directly connects the world of markets to that of factories and infrastructure.
Frequently asked questions on the copper price
Does the copper price really anticipate recessions?
Historically, several rapid copper drops preceded or accompanied industrial slowdowns, but it is not a perfect indicator. It also reflects supply factors, geopolitical events and inventory variations. Using it in isolation as a “recession signal” exposes the reader to false positives.
How can I track the copper price without spending my days in front of screens?
A pragmatic approach consists in looking once a week at the spot price level, the spread with 3-month contracts and public inventory trends. The essential is the trend over several weeks, not intraday micro-variations.
Can the rise of alternative materials durably push down the copper price?
Some applications shift to aluminum or other metals, but many uses (motors, high-quality electrical networks, electronics) remain heavily dependent on copper. Substitution slows the potential rise without necessarily challenging a higher price regime than in 2010–2019.
Can recycling projects offset the lack of mining supply?
Recycling is progressing and can cover a growing share of demand, especially in mature economies. But it depends on the stock already installed in buildings, vehicles and equipment, and is not always sufficient to follow phases of rapid demand growth.
Is it too late to integrate copper into a portfolio reflection?
Copper moves in cycles: what matters is not “being early” at all costs, but understanding the underlying regime (supply, capex, constraints) and its link with rates, currencies and growth. Even after several years of high prices, how to integrate it into an overall allocation remains a relevant question.
3 takeaways
- The copper price has become a leading indicator of reindustrialization and global capex, more than a simple proxy for China.
- Prices durably above the 2010–2019 average, with limited inventories, suggest a higher industrial cost regime.
- The spot / 3-month spread, inventories and real rates are three simple benchmarks for reading copper without falling into overinterpretation.
Last updated — 22 September 2026
Disclaimer – Financial Information: The analyses, commentary, and content published on eco3min.fr are provided for informational and educational purposes only. They do not constitute investment advice or a solicitation to buy or sell financial instruments. Past performance is not indicative of future results. All investment decisions involve risk and are the sole responsibility of the reader.
Read next
Full pillar →Reading the refinery utilisation rate: the threshold, the season, the turnarounds
A refinery runs full near ninety percent, not a hundred: the last slice of nameplate capacity is a…
IMO 2020: the regulatory shock that rewrote product spreads
An environmental rule on marine sulfur can move a refining spread more than a swing in crude. IMO…
The 2022–2023 refining golden age: anatomy of an episode
In 2022, refined fuel prices climbed faster than crude. That gap, measured by the 3-2-1 crack spread, reached…


