
Copper Stocks: Why Record Inventories Coexist With a Record Price
Exchange copper stocks are at their highest since 2003 while the price sets a record: since the 2025 US tariffs, they measure where metal moved rather than abundance.

Copper stocks on the major metal exchanges are supposed to measure physical tightness. Since the US tariffs of 2025, they mostly measure where the metal has been moved.
At the end of August 2026, those stocks stood at their highest level since 2003, in the same weeks that the copper price set a record.
TL;DR
Exchange inventories at a 23-year high and a record price in the same year: visible copper no longer says much about real scarcity.
- The LME, COMEX and SHFE held 997,600 tonnes at the end of August 2026, well above their end-2025 level (ICSG), driven by COMEX in New York.
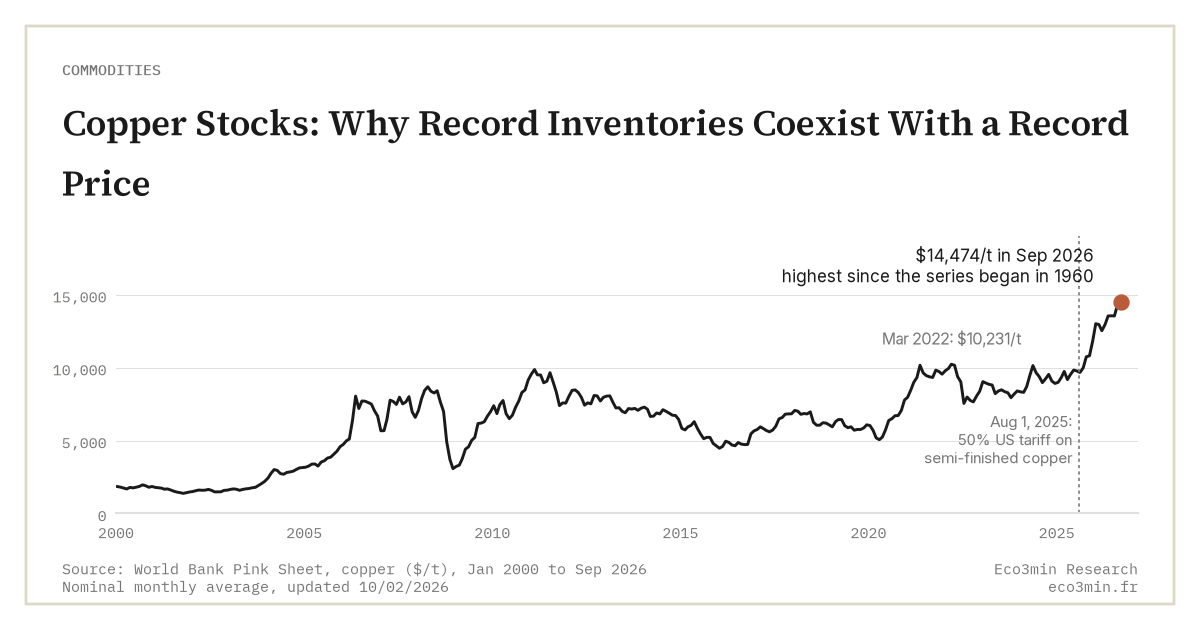
- Copper averaged $14,474 a tonne in September 2026, a nominal record in the World Bank’s monthly series going back to 1960.
- Primary copper mines that started up in 2019–2022 took 23 years on average from discovery to commercial production (S&P Global Market Intelligence).
A scarcity gauge that became a tariff gauge
The classic reading of copper stocks fits in one sentence. When the approved warehouses of the London Metal Exchange (LME), New York’s COMEX and the Shanghai Futures Exchange (SHFE) empty out, metal is scarce and the price rises. It worked for a long time. In 2025 it stopped working.
According to the International Copper Study Group’s release of January 21, 2026, stocks on the three exchanges rose sharply over 2025. The move was anything but uniform. The LME lost metal, while Shanghai and above all COMEX gained it. Copper did not pile up for lack of buyers. It crossed the Atlantic.
What the tariffs did to the warehouses
The trigger was American. Announced on July 8, 2025, the Section 232 tariff was set by Proclamation 10962 of July 30, 2025: 50% on semi-finished copper products and copper-intensive derivatives from August 1, 2025, applied only to their copper content. Refined copper was left out of that clause. The proclamation instead asked the Commerce Department for a report by June 30, 2026, ahead of a possible phased duty on refined copper of 15% from January 1, 2027 and 30% from January 1, 2028.
That timetable created a trade. As long as a future duty on refined copper remains possible, shipping cathode into the United States before it applies has value. The USGS Mineral Commodity Summaries 2026 estimate US refined copper imports at 1,700 thousand tonnes in 2025, against 903 thousand in 2024. Refined stocks held in the United States by producers, consumers and exchanges rose from 123 to 450 thousand tonnes in a year, and the USGS notes that the record 2025 COMEX price was attributed primarily to uncertainty over the tariffs.
Stocks rose because metal was being held where it might become more expensive.
More inventory, and a record price
The move has continued. The ICSG’s monthly release of September 24, 2026 put stocks on the three exchanges at 997,600 tonnes at the end of August 2026, the highest since June 2003. Stocks have kept rising since the end of 2025, on COMEX and the LME alike, while Shanghai’s have fallen. Measured against the world refined usage the ICSG forecasts for 2026 (28,664 thousand tonnes), they cover about 13 days of consumption.
The price did not read those stocks as abundance. In the World Bank’s monthly Pink Sheet series, copper went from $8,991 a tonne in January 2025 to $11,785 in December, then $14,474 in September 2026. That is the highest nominal level since the series began in 1960, well above the previous peak of $10,231 in March 2022.
Adding up the three exchanges as if they formed a single available reserve. A tonne held in a COMEX warehouse ahead of a possible tariff is not on offer to a Chinese or European fabricator at the same price. Since 2025, how stocks are split between exchanges matters more than their total.
The ICSG balance does not describe a shortage
The structural-deficit story finds no support in the ICSG’s accounts either. Its monthly data show a refined copper surplus of 463 thousand tonnes in 2025. Its April 2026 forecast pointed to a surplus of about 96,000 tonnes in 2026 and 377,000 in 2027, after a 150,000-tonne deficit had been forecast for 2026 in October 2025. The ICSG itself warns that these balances exclude unreported stocks in China, from the state reserve to bonded warehouses.
The weak point lies upstream. World mine production fell 1% in the first seven months of 2026, according to the same release. The ICSG had already cut its 2026 mine growth forecast from 2.3% to 1.6%. This is where inertia bites: primary copper mines that started up between 2019 and 2022 had taken 23 years on average since discovery, according to an April 2023 S&P Global Market Intelligence study. A record price will not bring an extra mine on stream before the next decade.
Two measures that say more than the total
The first is the spread between exchanges. When COMEX swells while Shanghai drains, the market is paying a geographic premium, not pricing global scarcity. The second is the ICSG’s monthly refined balance, and within it the mine production line. That line will decide whether an accounting surplus turns into genuine tightness.
The picture would reverse if Washington dropped the refined copper duty. Part of the US stockpile would head back to the LME, and visible stocks could fall with no change in consumption. Copper then reads better in relative terms, for instance against gold, as in the analysis of copper versus gold as a growth gauge. The reliability of the exchanges themselves is discussed in the piece on the LME’s credibility after nickel.
Visible copper has not disappeared. It has changed meaning, and today it measures trade policy as much as a market. Trade policy also shows up on the federal books, where the monthly balance of US customs duties collected and refunded since 2015 went negative three months running in 2026.
Last updated — 21 October 2026
Disclaimer – Financial and Legal Information: The analyses, commentary, and content published on eco3min.fr are provided for informational and educational purposes only. They do not constitute investment advice or a solicitation to buy or sell financial instruments. Past performance is not indicative of future results. All investment decisions involve risk and are the sole responsibility of the reader. Data, charts and calculated series are provided as is and may contain errors or lag behind their source: check any figure against the primary source cited before relying on it. Content describing laws, regulations or contracts reflects the law as of its publication date and does not constitute legal or tax advice; applying it to a specific situation requires a qualified legal or tax professional.
Read next
Full pillar →Commodities and the Business Cycle: A Leading Indicator of Economic Regimes
Year-over-year change in the World Bank commodity price index (Total Index, 2010=100) leads US consumer price inflation by…
Reading the refinery utilisation rate: the threshold, the season, the turnarounds
A refinery runs full near ninety percent, not a hundred: the last slice of nameplate capacity is a…
The 2022–2023 refining golden age: anatomy of an episode
In 2022, refined fuel prices climbed faster than crude. That gap, measured by the 3-2-1 crack spread, reached…