
The Copper/Gold Ratio: Growth Against Safe Haven

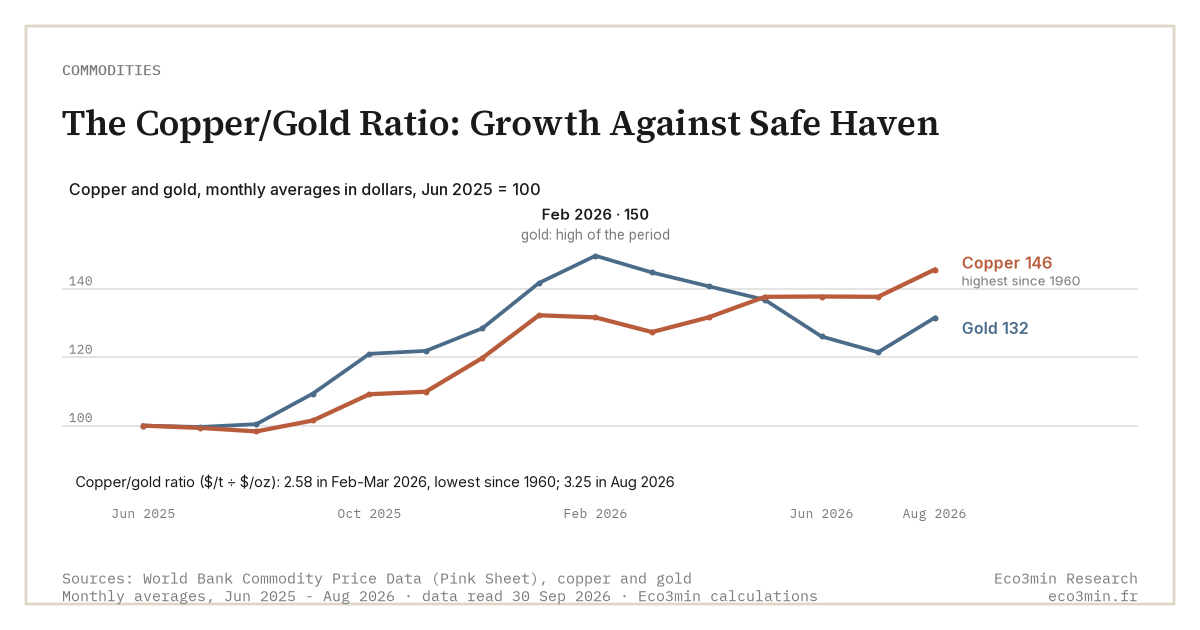
The copper/gold ratio sets the price of the most industrial metal against that of the most defensive one. Its direction works as a gauge: it rises when the market bets on growth, it falls when fear of a slowdown takes over.
TL;DR
The copper/gold ratio has tracked the US 10-year Treasury yield for years, both rising on stronger nominal growth, yet in 2026 both metals climbed together near records.
- By mid-June 2026, copper averaged $13,552 a tonne ($6.15 a pound, World Bank), up 38% year on year, before a monthly record of $14,326 in August, while gold sat around $4,200 an ounce after a $5,405 fixing record on 29 January.
- The ratio hit its lowest since 1960 in February-March 2026, then recovered, driven by two tight markets at once: a structural copper supply deficit on one side, central-bank gold buying and de-dollarization on the other.
- Reading the level alone misleads: the copper leg tracks manufacturing surveys, Chinese credit and mine supply, while the gold leg follows real rates and official demand.
Yet 2026 blurs this usual signal: copper and gold sit together near their records, each lifted by distinct structural forces. Here too, one must know which of the two legs is speaking.
Dr. Copper and the defensive metal
Copper carries a telling nickname: Dr. Copper, said to diagnose the health of the world economy ahead of official statistics. Used in construction, power grids, electronics, electric vehicles and now computing infrastructure, its demand tracks the industrial cycle. China, which absorbs more than half of global consumption, makes it a direct barometer of manufacturing activity.
Gold occupies the other end of the spectrum. With no dominant industrial use, it thrives when growth disappoints, when real rates fall or when distrust of currency sets in. Setting one against the other thus pits an asset that loves expansion against an asset that loves uncertainty.
The quotient of the two prices delivers a simple measure of the prevailing mood. When investors expect an acceleration, they favour the industrial metal and the ratio climbs; when they fear a turn, they take refuge in gold and the ratio sags. It is, in a single curve, the trade-off between growth and protection. More context: gold’s diversification profile.
The ratio is usually read as copper per pound divided by gold per ounce, a small decimal that analysts plot, rescaled, against bond yields. The number itself matters less than its trajectory: what the curve tracks is the direction of growth expectations, not an absolute level. A broader view: how the copper-gold ratio tracks Treasury yields.
The red metal’s diagnosis is not infallible. The financialization of markets, index-fund flows and, more recently, structural demand tied to the energy transition, less cycle-sensitive than traditional construction, have made its signal noisier. Copper remains a barometer, but one whose reading now demands more caution than in the days when its demand hinged mostly on Chinese real estate. On this specific point: copper versus iron ore on demand.
A cycle barometer, anchored to long rates
This reading is no accident. Investors and analysts have long set the copper/gold ratio alongside the US 10-year Treasury yield: both rise when the market bets on stronger nominal growth, and fall together when the outlook darkens. The ratio thus acts as a proxy for the growth and inflation expectations that the long rate sums up on the bond side. This kinship sheds light on gold’s defensive role from a complementary angle: the same swing between risk and safety appears, but through two metals.
Stress episodes illustrate it starkly. In the autumn of 2008, the collapse of world trade sent copper falling from about $4 a pound to nearly $1.3 within months, while gold held: the ratio collapsed, signalling recession before it was acknowledged. Conversely, the 2021 recovery, driven by the post-pandemic reopening, drove copper toward $4.7 a pound and sent the ratio surging, a marker of the great reflation move.
The spring of 2020 offered a compressed version. Copper briefly slid toward $2.1 a pound as the pandemic froze activity, before a V-shaped rebound; gold, meanwhile, climbed to $2,067 at the 6 August 2020 fixing. The ratio dropped then recovered within months, retracing the market’s swing from panic to reflation faster than any official series could.
The two legs differ in temperament. Copper is sharply cyclical, swinging with industrial demand and supply shocks; gold moves along slower monetary cycles. This point is set in its broader context by our frame for the physical commodity complex. The ratio therefore blends a volatile numerator and a more inert denominator, which is why its sharpest moves usually come from the copper side. Related framing: silver’s behaviour across inflation regimes.
Not every swing is abrupt. Between 2011 and 2016, China’s slowdown drove copper back from about $4.5 to nearly $2 a pound, while gold fell more slowly, from $1,895 at the September 2011 fixing to $1,049 in December 2015: the ratio declined slowly, over several years, with no crash. This gradual erosion reflected a fading of global industrial demand, a more diffuse cycle signal but one just as readable as the sudden collapses. Once commodities are read as signals of the macroeconomic regime, slow drifts carry as much information as crashes.
The 2026 anomaly: both metals at records
The present complicates the reading. In mid-June 2026, copper averaged $13,552 a tonne ($6.15 a pound, World Bank Pink Sheet), up 38% year on year, ahead of a monthly record of $14,326 in August; it had been close to a first peak in late January; gold hovered around $4,200 an ounce after its own record of $5,405 at the 29 January fixing. The two metals, supposed to diverge, are rising in step.
The reason lies in distinct structural drivers. Copper is underpinned by a lasting supply deficit: analysts expect a recurring shortfall through the decade, against demand pulled by electrification, grids and data centres, and supply strains worsened by US import tariffs, which opened an unprecedented COMEX premium over the LME. Gold, for its part, is driven by central-bank buying and de-dollarization. The detail of this relationship appears in the copper/gold ratio dataset, and the red metal’s role as a leading signal is explored in the analysis of copper as a growth indicator.
The supply side is unusually tight. Mine output has been held back by slower-than-expected recoveries at major operations and by years of under-investment, while Chile, the largest producer, faces ageing deposits. Estimates of a lasting deficit have kept the market braced for scarcity, independent of the business cycle. Visible inventories have stayed low and smelter treatment charges compressed, all signs of a physical market under lasting strain.
The consequence: the ratio can collapse without a recession. In February 2026, an ounce of gold bought 855 pounds of copper (a ratio of 2.58 dollars a tonne per dollar an ounce, World Bank), the lowest since 1960, because gold outran copper; by August, the ratio was back at 3.25 on copper’s record. In 2026, its level reflects neither euphoric growth nor refuge panic, but the coexistence of two shortages, one physical, the other monetary.
The unusual character of 2026 is worth underlining. Copper and gold normally move in opposite directions: one thrives on risk, the other on fear. Their simultaneous rise, rare, signals a particular regime in which real assets are sought on all sides, against a backdrop of fiscal and monetary worries. The ratio, in this context, says less about the growth-versus-refuge trade-off than about the broad premium placed on the tangible. A parallel read: how the vehicle reshapes a gold position.
The nature of demand has shifted. Beyond construction, the electrification of transport, the expansion of grids and the proliferation of data centres call for growing quantities of metal, at a pace less dependent on the classic business cycle. This structural, lasting component explains why copper can stay firm even when traditional industry slows, blurring its function as a growth indicator a little further. A blurred indicator still has a rank: one ounce of gold bought 855 pounds of copper in February 2026, the most since 1975.
Decompose, as with the neighbouring ratios
The limit is by now familiar: a cross-asset ratio is never read by its level alone. A rise in the copper/gold ratio can signal a genuine industrial recovery, or merely a weakening gold; a fall, a coming recession, or copper hit by a one-off supply shock. Only examining the two metals separately settles it, and 2026 offers the clearest illustration.
What observers tend to watch, on each side, follows from this. On the copper leg, manufacturing surveys, Chinese credit and mine-supply news set the industrial signal; on the gold leg, real rates and official demand drive the monetary one. Following the ratio without tracking these two sets separately risks mistaking an industrial move for a monetary one.
The same principle holds for the other ratios in the family. The S&P 500 in gold measures equity valuation against the metal, while the gold/oil ratio sets money against energy. Placed within the physical resource markets, these three quotients form a regime grid, provided one always identifies which component carries the move.
Applied to 2026, this discipline yields a clear reading. The ratio hit its lowest since 1960, then rebounded 26% with no change in the global economic regime, because both its components rose sharply at different speeds: the signal is neither strong growth nor dominant fear, it is scarcity on both sides. An observer relying on the ratio’s level alone would miss most of what 2026 is telling.
Mechanically reading a rise in the copper/gold ratio as a sign of stronger growth ignores its dual composition. In 2026, the ratio is held up as much by copper scarcity as by gold’s surge: it reflects two tight markets for opposite reasons, not a clean growth signal. The level is never enough; one must watch which metal moves.
A cycle gauge, to be handled with both faces
The copper/gold ratio keeps its value as a synthesis: few indicators sum up so directly the tension between the appetite for growth and the need for protection. Its historical closeness to long rates makes it a useful cycle marker, as long as one never forgets that it combines two markets with their own logic.
Its reach, ultimately, is that of a composition indicator. Seeing copper and gold side by side forces one to ask, at each move, whether it is the factory or the vault speaking, a question that neither the industrial metal nor the safe-haven one, taken alone, settles.
The 2026 configurations remain open. An easing in safe-haven demand would lift the ratio with no real acceleration in the economy; a retreat in copper, conversely, would lower it with no recession. Like its neighbours, this ratio describes a regime; it does not predict one.
Last updated — 7 October 2026
Disclaimer – Financial and Legal Information: The analyses, commentary, and content published on eco3min.fr are provided for informational and educational purposes only. They do not constitute investment advice or a solicitation to buy or sell financial instruments. Past performance is not indicative of future results. All investment decisions involve risk and are the sole responsibility of the reader. Data, charts and calculated series are provided as is and may contain errors or lag behind their source: check any figure against the primary source cited before relying on it. Content describing laws, regulations or contracts reflects the law as of its publication date and does not constitute legal or tax advice; applying it to a specific situation requires a qualified legal or tax professional.
Read next
Full pillar →The Copper-Gold Ratio as a Macro Signal: Still a Reliable Gauge of Treasury Yields in 2024-2026?
The copper-gold ratio pits a growth metal against a safe haven, and for years it tracked the 10-year…
Pure-play refiners versus integrated majors: downstream margin exposure
A pure-play refiner owns only the downstream, so its earnings track the refining margin. An integrated major also…
Jet fuel, the forgotten margin: the jet crack and the aviation link
The 3-2-1 crack spread reduces the refining margin to two products, gasoline and diesel. Jet fuel sits outside…